The market has calmed down a bit in the past few days, even though it seems clear that the bears are in the driving seat. This happened as the bulls managed to defend the $1,500 level and are currently trying to recoup. Even though the negative momentum decreased, it’s still early to weave the possibility of a subsequent collapse out.
Technical Analysis
By Grizzly
The Daily Chart
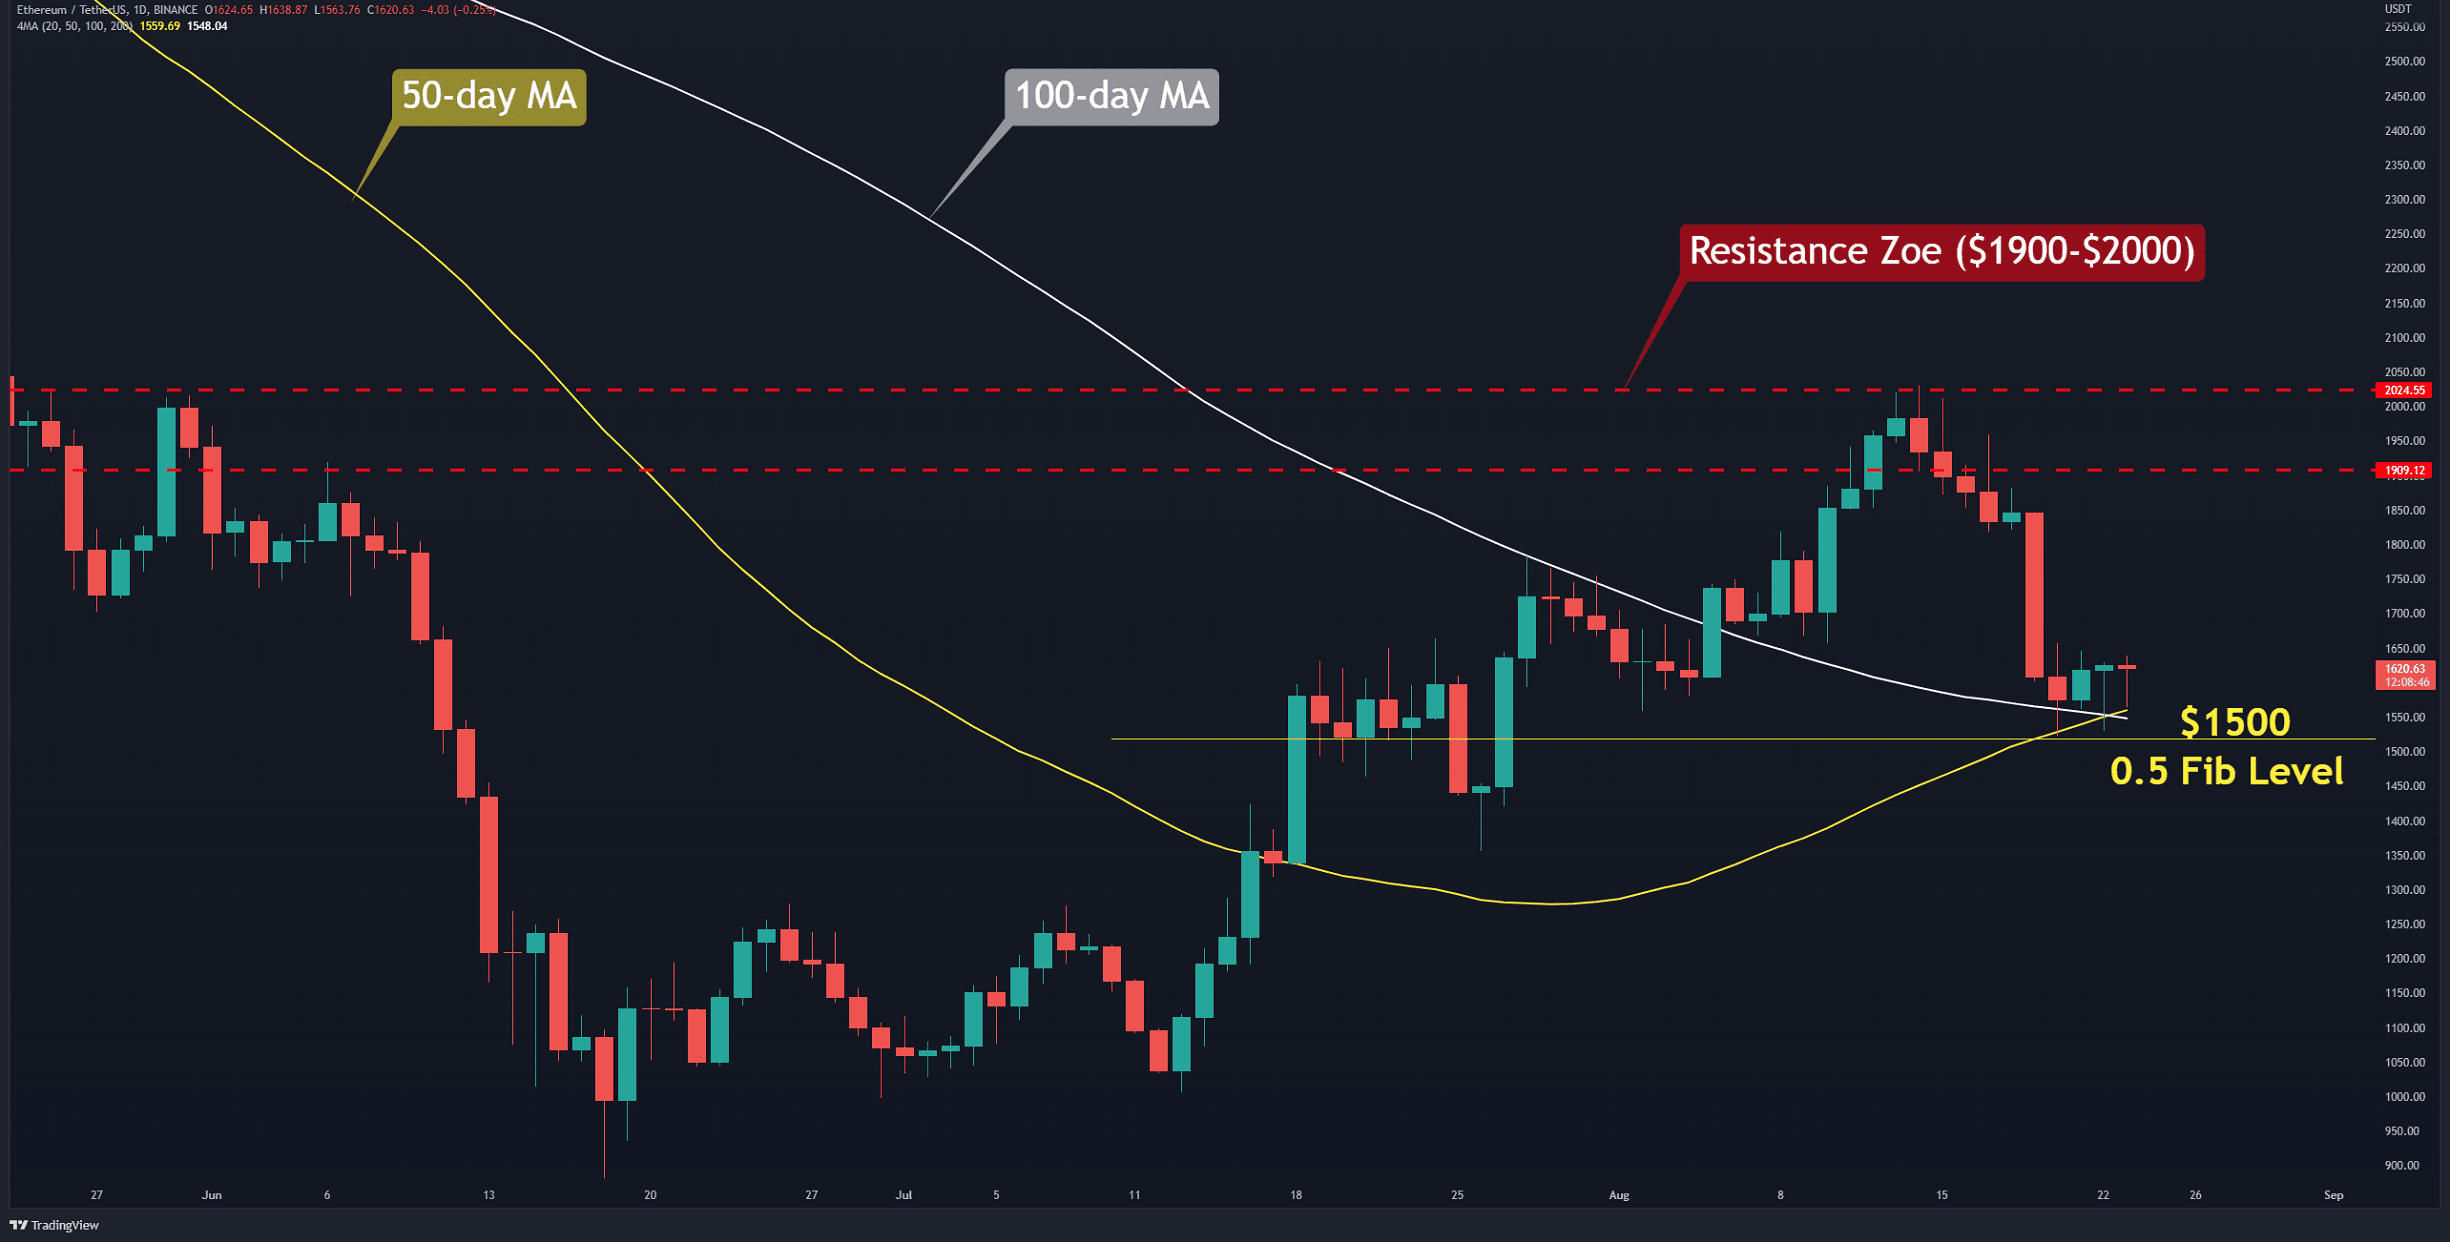
The intersecting of the 100-day (in white) and 50-day (in yellow) moving average lines served as support on the daily chart. This level has currently prevented ETH from dropping further. The 0.5 Fibonacci Retracement level is also around $1,500, making this a solid level to keep an eye on.
However, it’s also important to keep the macroeconomic overview in mind. The DXY index has started a new bullish trend and is close to breaking the previous high. This is not good news for high-risk assets like stocks and crypto. Aside from the imminent Merge event for Ethereum, which is inherently bullish, the second-largest asset by market capitalization doesn’t seem to have avoided a correction in the market.
If the bears push the price below $1500, this will invalidate the bullish structure. In this case, reaching the support in the range of $1,280-$1,350 and retesting it will be more likely. Such a move can make it difficult to form a bullish trend in the future, and the bear market will probably be prolonged.
On the other hand, the bulls have a chance to retest $2,000 if they can extend the price above $1,800 in the next few days.
Key Support Levels: $1500 & $1350
Key Resistance Levels: $1800 & $2000
Daily Moving Averages:
MA20: $1766
MA50: $1559
MA100: $1547
MA200: $2213
The ETH/BTC Chart
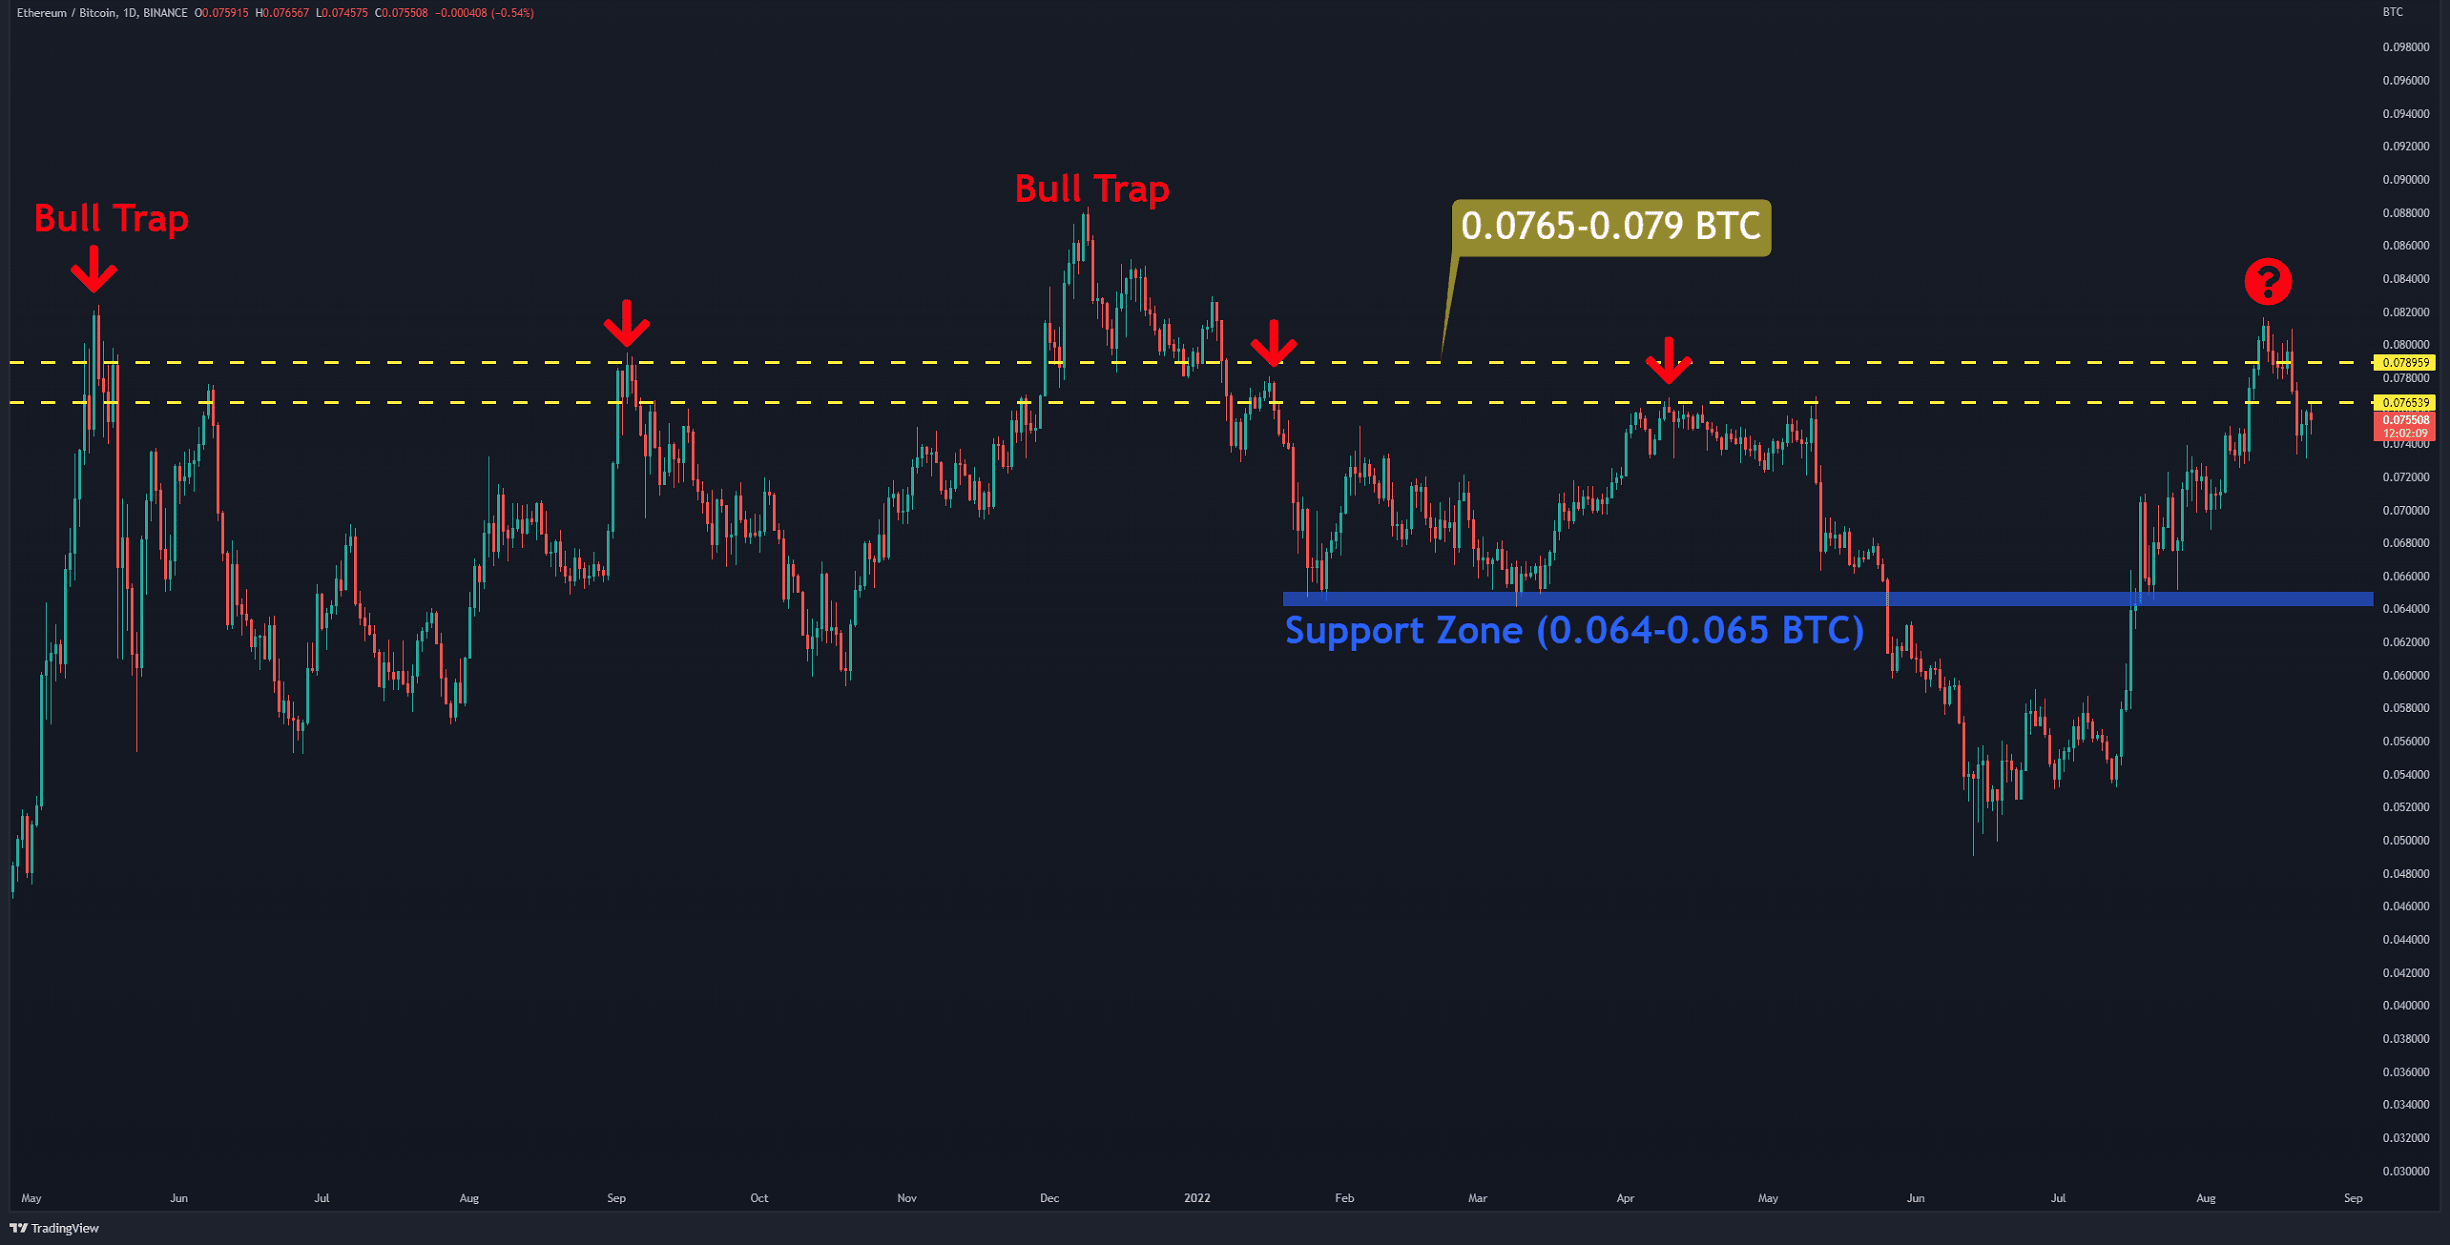
Against Bitcoin, the price retests the resistance in the 0.0765-0.79 BTC range (in yellow). This level has played an essential role in the past and has commonly given grounds for the formation of bull traps.
Although it is impossible to predict the future based on past events, considering the recent vertical bullish trend, it seems reasonable to be more cautious. Another rally will begin if the ETH price against BTC can break above the last high (0.082 BTC).
Key Support Levels: 0.0.073 & 0.065 BTC
Key Resistance Levels: 0.082 & 0.088 BTC
Binance Free $100 (Exclusive): Use this link to register and receive $100 free and 10% off fees on Binance Futures first month (terms).
PrimeXBT Special Offer: Use this link to register & enter POTATO50 code to receive up to $7,000 on your deposits.
Disclaimer: Information found on CryptoPotato is those of writers quoted. It does not represent the opinions of CryptoPotato on whether to buy, sell, or hold any investments. You are advised to conduct your own research before making any investment decisions. Use provided information at your own risk. See Disclaimer for more information.
Cryptocurrency charts by TradingView.
- Bitcoin
- blockchain
- blockchain compliance
- blockchain conference
- coinbase
- coingenius
- Consensus
- crypto conference
- crypto mining
- Crypto News
- cryptocurrency
- CryptoPotato
- decentralized
- DeFi
- Digital Assets
- ETH Analysis
- ethbtc
- ethereum
- Ethereum (ETH) Price
- ETHUSD
- machine learning
- non fungible token
- plato
- plato ai
- Plato Data Intelligence
- Platoblockchain
- PlatoData
- platogaming
- Polygon
- proof of stake
- W3
- zephyrnet