Ethereum price is moving lower below the $1,800 support against the US Dollar. ETH could accelerate lower toward the $1,650 support in the near term.
- Ethereum is currently moving lower from the $1,850 resistance zone.
- The price is trading below $1,820 and the 100-hourly Simple Moving Average.
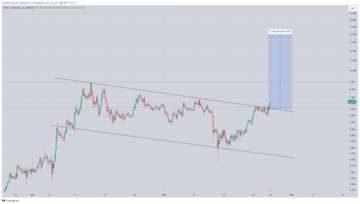
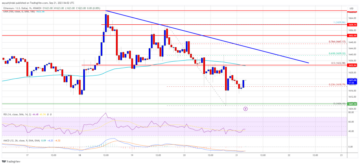
- There is a major bearish trend line forming with resistance near $1,800 on the hourly chart of ETH/USD (data feed via Kraken).
- The pair could start a decent increase if there is a move above the $1,800 and $1,830 resistance levels.
Ethereum Price Turns Red
Ethereum’s price failed to start a recovery wave above the $1,850 resistance zone. ETH remained in a bearish zone and traded below the $1,830 support, similar to Bitcoin.
The decline was such that the price even broke the $1,800 support. A new weekly low is formed near $1,770 and the price is now trading in the red zone. Ether is well below $1,820 and the 100-hourly Simple Moving Average. There is also a major bearish trend line forming with resistance near $1,800 on the hourly chart of ETH/USD.
Immediate resistance is near the $1,800 level or the 23.6% Fib retracement level of the recent decline from the $1,888 swing high to the $1,770 low.
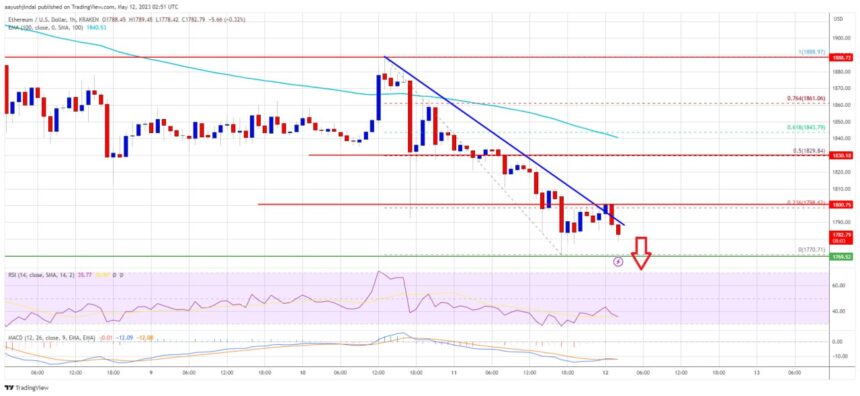
The next resistance sits near $1,830 or the 50% Fib retracement level of the recent decline from the $1,888 swing high to the $1,770 low, above which Ethereum could test the 100-hourly Simple Moving Average. If there is a move above the $1,830 and $1,840 resistance levels, the price might rise toward the $1,880 level. Any more gains above the $1,880 resistance zone could start a decent increase toward the $1,920 resistance.
More Losses in ETH?
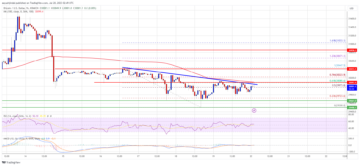
If Ethereum fails to clear the $1,830 resistance, it could continue to move down. Initial support on the downside is near the $1,770 level.
The next major support is near the $1,740 zone. If there is a clear move below the $1,740 support, the bears could gain strength and the price might decline heavily. The price might drop toward the $1,650 support zone in the stated case. Any more losses may perhaps take the price toward the $1,600 level in the near term.
Technical Indicators
Hourly MACD – The MACD for ETH/USD is now gaining momentum in the bearish zone.
Hourly RSI – The RSI for ETH/USD is below the 50 level.
Major Support Level – $1,770
Major Resistance Level – $1,830
Chart from Tradingview
- SEO Powered Content & PR Distribution. Get Amplified Today.
- PlatoAiStream. Web3 Data Intelligence. Knowledge Amplified. Access Here.
- Minting the Future w Adryenn Ashley. Access Here.
- Buy and Sell Shares in PRE-IPO Companies with PREIPO®. Access Here.
- Source: https://www.newsbtc.com/analysis/eth/ethereum-bears-hesitate-1650/
- :is
- 23
- 50
- a
- above
- accelerate
- against
- also
- and
- any
- average
- bearish
- Bears
- below
- Broke
- but
- case
- Chart
- clear
- continue
- could
- Currently
- data
- Decline
- Dollar
- down
- downside
- downsides
- Drop
- ETH
- ETH/USD
- Ether
- ethereum
- ETHUSDT
- Even
- Failed
- fails
- For
- formed
- from
- further
- Gain
- gaining
- Gains
- heavily
- High
- HTTPS
- if
- in
- Increase
- initial
- IT
- jpg
- Kraken
- Level
- levels
- likely
- Line
- losses
- Low
- MACD
- major
- max-width
- May..
- might
- Momentum
- more
- move
- moving
- moving average
- Near
- New
- NewsBTC
- next
- now
- of
- on
- or
- pair
- perhaps
- plato
- Plato Data Intelligence
- PlatoData
- price
- recent
- recovery
- Red
- remained
- Resistance
- retracement
- Rise
- rsi
- seem
- similar
- Simple
- sits
- Source
- start
- stated
- strength
- such
- support
- support level
- Swing
- Take
- term
- test
- that
- The
- There.
- to
- toward
- traded
- Trading
- TradingView
- Trend
- turns
- us
- US Dollar
- via
- was
- Wave
- weekly
- WELL
- which
- with
- zephyrnet