- Ethereum price is slowly moving higher from the $1,180 level against the US Dollar.
- ETH price is now trading above $1,180 and the 55 simple moving average (4-hours).
- There is a major bullish trend line forming with support near $1,195 on the 4-hours chart (data feed from Coinbase).
- The pair could start a decent increase if it clears the $1,250 resistance zone.
Ethereum price is struggling below $1,250 against the US Dollar. ETH/USD could start a decent increase if it clears the $1,250 resistance zone.
Ethereum Price Analysis
This past week, ethereum remained well bid above the $1,165 level against the US Dollar. ETH price formed a base and slowly moved higher above the $1,180 level.
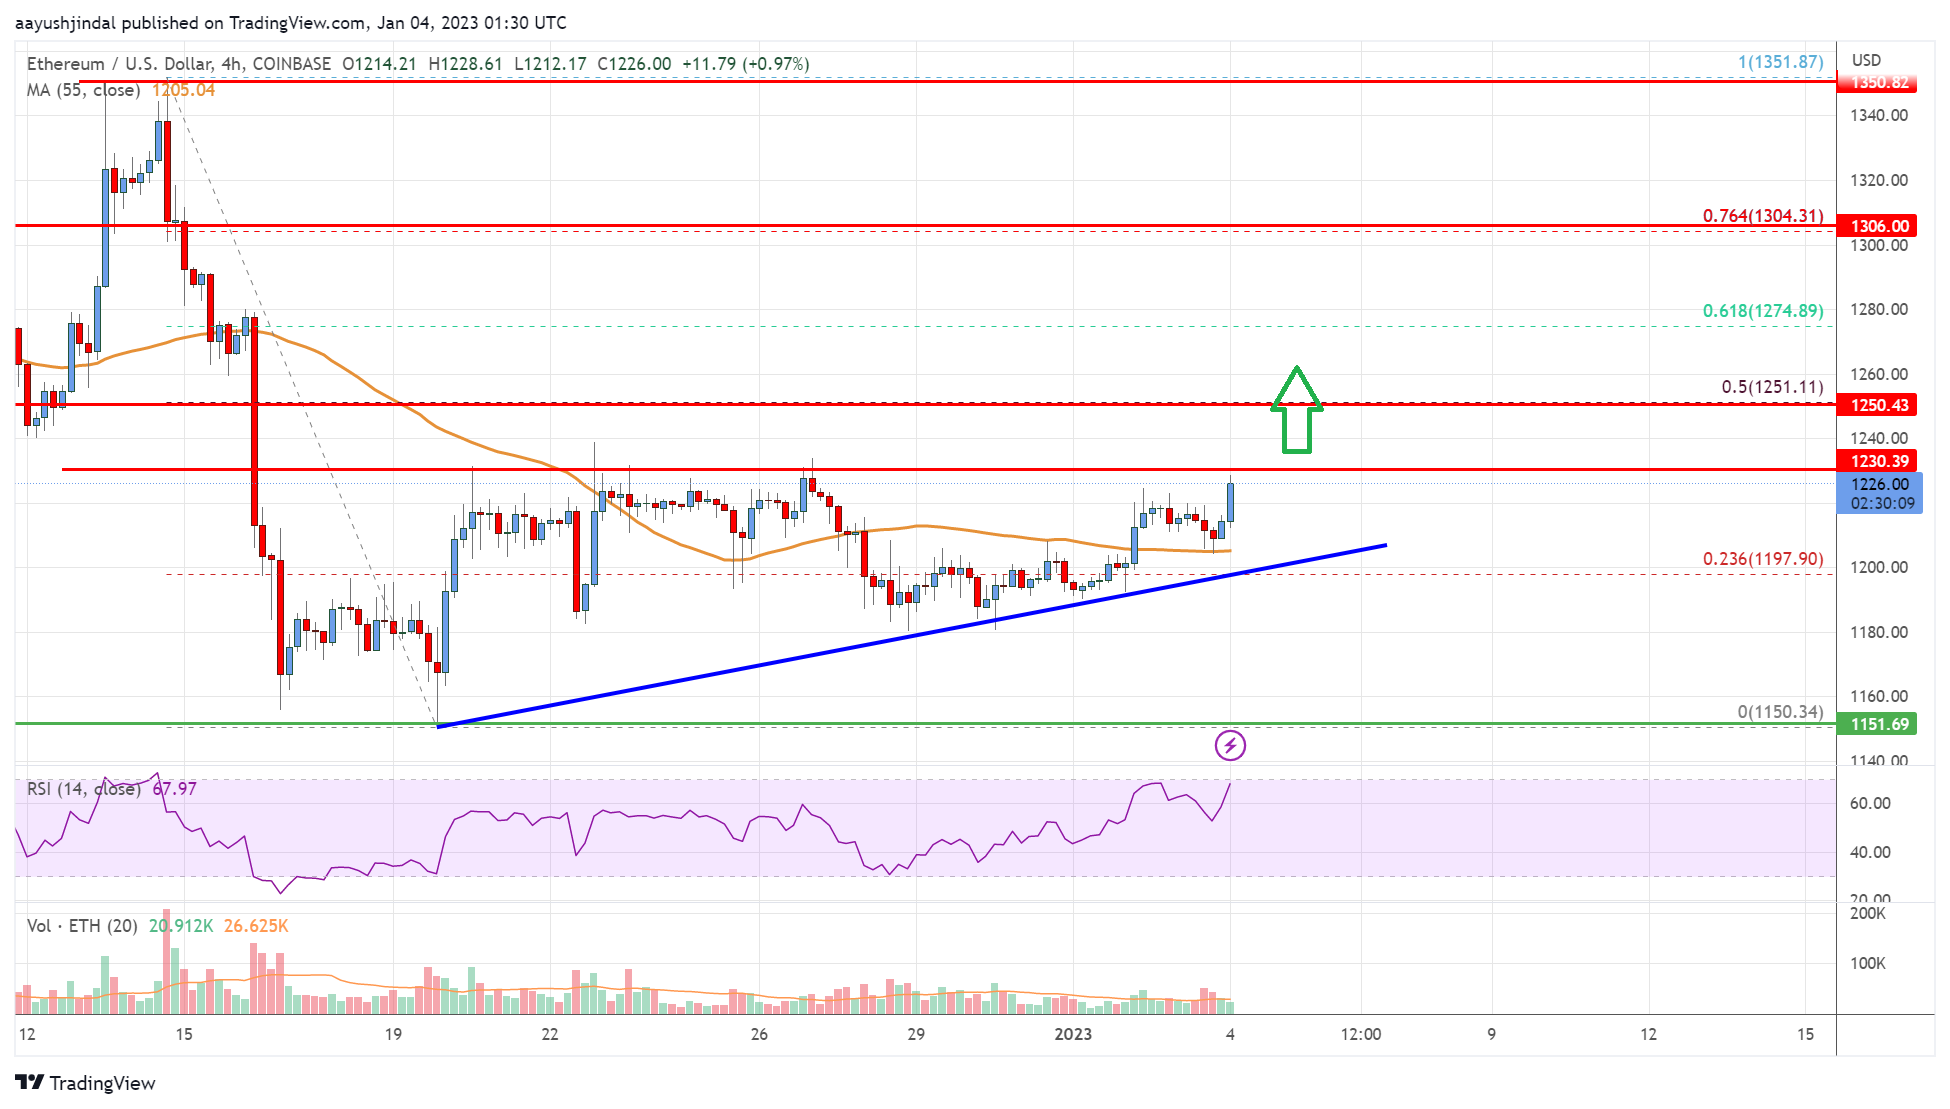
The price climbed above the 23.6% Fib retracement level of the key decline from the $1,351 swing high to $1,150 low. Ether price is now trading above $1,180 and the 55 simple moving average (4-hours). There is also a major bullish trend line forming with support near $1,195 on the 4-hours chart.
However, the price is now facing a major hurdle near the $1,230 level. The first major resistance is near the $1,250 level. It is near the 50% Fib retracement level of the key decline from the $1,351 swing high to $1,150 low. The next major resistance is near the $1,274 zone.
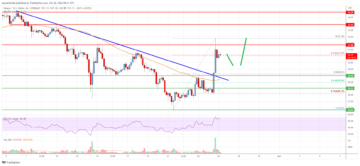
The main resistance is near the $1,300 zone. A clear move above the $1,274 and $1,300 resistance levels might call for a fresh move to $1,350. Any more gains could even send the price towards the $1,400 resistance zone or even $1,450 in the near term.
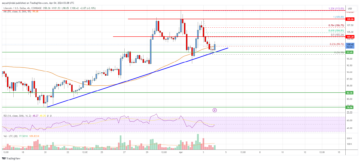
On the downside, an initial support is near the $1,200 level and the trend line. The next major support is now near the $1,180 level. A break below the $1,180 support could push the price to $1,150. If the bulls struggle to protect the $1,150 support, the price might decline towards $1,080.
Ethereum Price
Looking at the chart, Ethereum price is clearly trading above $1,200 and the 55 simple moving average (4-hours). Overall, ether price could start a decent increase if it clears the $1,250 resistance zone.
Technical indicators
4 hours MACD – The MACD for ETH/USD is now gaining momentum in the bullish zone.
4 hours RSI (Relative Strength Index) – The RSI for ETH/USD is now above the 50 level.
Key Support Levels – $1,200, followed by the $1,150 zone.
Key Resistance$ Levels – $1,250 and $1,275.
- SEO Powered Content & PR Distribution. Get Amplified Today.
- Platoblockchain. Web3 Metaverse Intelligence. Knowledge Amplified. Access Here.
- Source: https://www.livebitcoinnews.com/ethereum-price-analysis-eth-could-gain-pace-above-1250/
- a
- above
- against
- analysis
- and
- average
- base
- below
- Break
- Bullish
- Bulls
- call
- Chart
- clear
- clearly
- Climbed
- coinbase
- comments
- could
- data
- Decline
- Dollar
- downside
- ETH
- eth price
- ETH/USD
- Ether
- Ether Price
- ethereum
- Ethereum Price
- Ethereum Price Analysis
- Even
- facing
- First
- follow
- followed
- formed
- fresh
- from
- Gain
- gaining
- Gains
- High
- higher
- HOURS
- HTTPS
- in
- Increase
- index
- initial
- internal
- IT
- Key
- Level
- levels
- Line
- Low
- MACD
- Main
- major
- might
- Momentum
- more
- move
- moving
- moving average
- Near
- next
- overall
- Pace
- past
- plato
- Plato Data Intelligence
- PlatoData
- Post
- price
- Price Analysis
- protect
- Push
- relative strength index
- Resistance
- retracement
- rsi
- Simple
- Slowly
- start
- strength
- Struggle
- Struggling
- support
- support levels
- TAG
- The
- to
- towards
- Trading
- TradingView
- Trend
- us
- US Dollar
- week
- zephyrnet