TL;DR Breakdown
- Ethereum price analysis reveals that Ethereum is going extremely bullish.
- Current support is found at the $3,538 mark.
- Current resistance is found at the $3,670 mark.
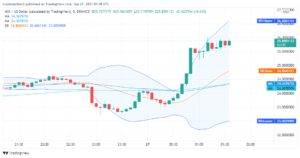
Ethereum price analysis charts reveal that the cryptocurrency is going extremely bullish at the time of writing; however, after a flash rise, the queen of cryptocurrency has hit a resistance snag at the $3,670 mark. At the time of writing, the queen of cryptocurrency is trading hands for the $3,628 mark fluctuating between the $3,635 and $3,625 marks. The queen had hit the 7th of September flash crash with the king of cryptocurrency, and at the time of writing, both the king and queen are enjoying heavy bullish momentum after days of slow movements and a slow rise in the price.
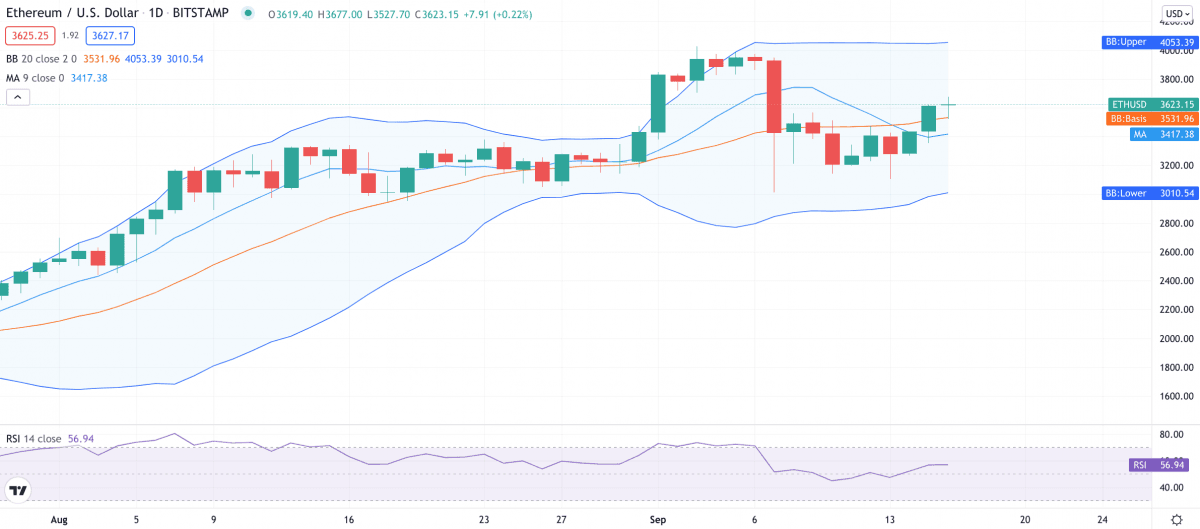
Ethereum price analysis 1-day chart extremely bullish
The one-day Ethereum price analysis chart reveals that the queen of cryptocurrency is enjoying extremely bullish momentum at the time of writing. The volatility has decreased for the queen, and the stability has increased by many folds. The upper Bollinger band presenting the strongest resistance mark is found at the $4,053 mark, while the lower Bollinger band showing the strongest support mark is found at the $3,010 mark.

The Bollinger bands’ average and the nine-day moving averages are both showing bullish crossovers serving as support under the current price. The Bollinger bands’ average is found at the $3,531 mark, and the nine-day moving average is found at the $3,417 mark. The relative strength index shows a current score of 54.94 playing in the neutral zone favoring the bullish momentum by many folds.
ETH/USD 4 hour chart shows minor snag
The four-hour Ethereum price analysis chart shows a slight snag on the chart with two out of three last candles showing in red, and the current candle is in red due to the snag ETH price hit. The current price is considered extremely bullish as, during the past 24-hours, Ethereum has been up by 6.19 percent and over 2.13 percent in the past seven days.

The volatility has also increased for the queen of cryptocurrency; however, it is still lower than the 1-day chat. The upper Bollinger band is found at the $3,666 mark, while the lower Bollinger band also marking the strong support is found at the $3,131 mark. The nine-day moving average and the Bollinger bands’ average are presenting strong support, where the nine-day moving average is found at the $3,518 mark. The Bollinger bands’ moving average is found at the $3,399 mark. The relative strength index is found slightly on the bullish side, with a score of 63.94.
Ethereum price analysis conclusion
The current snag is only a minor drawback that Ethereum’s price would overcome over time. The queen of cryptocurrency, if it finds persistent support is likely to retest the $4,000 high in the days to come. However, if the price support levels falter in any way, the queen of cryptocurrency is likely to hold the current support levels with great zeal to ensure that the bullish momentum stays in control of the current market situation. For now, the momentum is bullish, and the queen is enjoying the momentum.
Disclaimer. The information provided is not trading advice. Cryptopolitan.com holds no liability for any investments made based on the information provided on this page. We strongly recommend independent research and/or consultation with a qualified professional before making any investment decisions.
Source: https://api.follow.it/track-rss-story-click/v3/tHfgumto13BA7exh9UtWrCoxzwoq1nFt
- 000
- advice
- analysis
- Bullish
- Charts
- Crash
- cryptocurrency
- Current
- data
- ETH
- eth price
- ethereum
- Ethereum Price
- Ethereum Price Analysis
- finds
- Flash
- great
- High
- hold
- HTTPS
- index
- information
- investment
- Investments
- IT
- King
- liability
- Making
- mark
- Market
- Momentum
- move
- price
- Price Analysis
- research
- serving
- Stability
- support
- time
- Trading
- Volatility
- writing