Ethereum price started a fresh decline from the $1,920 resistance against the US Dollar. ETH is moving lower and might dive below the $1,850 support.
- Ethereum is struggling to gain bullish momentum above the $1,920 resistance.
- The price is trading below $1,900 and the 100-hourly Simple Moving Average.
- There was a break below a key bullish trend line with support near $1,895 on the hourly chart of ETH/USD (data feed via Kraken).
- The pair could continue to move down toward the $1,840 and $1,800 levels.
Ethereum Price Faces Another Rejection
Ethereum’s price attempted another increase above the $1,900 resistance. However, ETH struggled to clear the $1,920 resistance and started another decline, similar to Bitcoin.
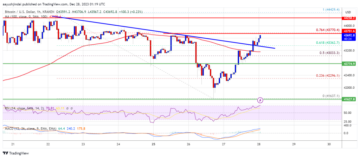
There was a move below the $1,900 support zone. The bears pushed the price below the 50% Fib retracement level of the upward move from the $1,838 swing low to the $1,914 high. Besides, there was a break below a key bullish trend line with support near $1,895 on the hourly chart of ETH/USD.
Ether is now trading below $1,900 and the 100-hourly Simple Moving Average. It is also testing the 61.8% Fib retracement level of the upward move from the $1,838 swing low to the $1,914 high.
If the price stays above the $1,865 support, it could attempt a fresh increase. Immediate resistance is near the $1,900 zone and the 100-hourly Simple Moving Average. The next major resistance is near the $1,900 level. A proper move above the $1,900 and $1,920 resistance levels might send Ether toward $1,940.
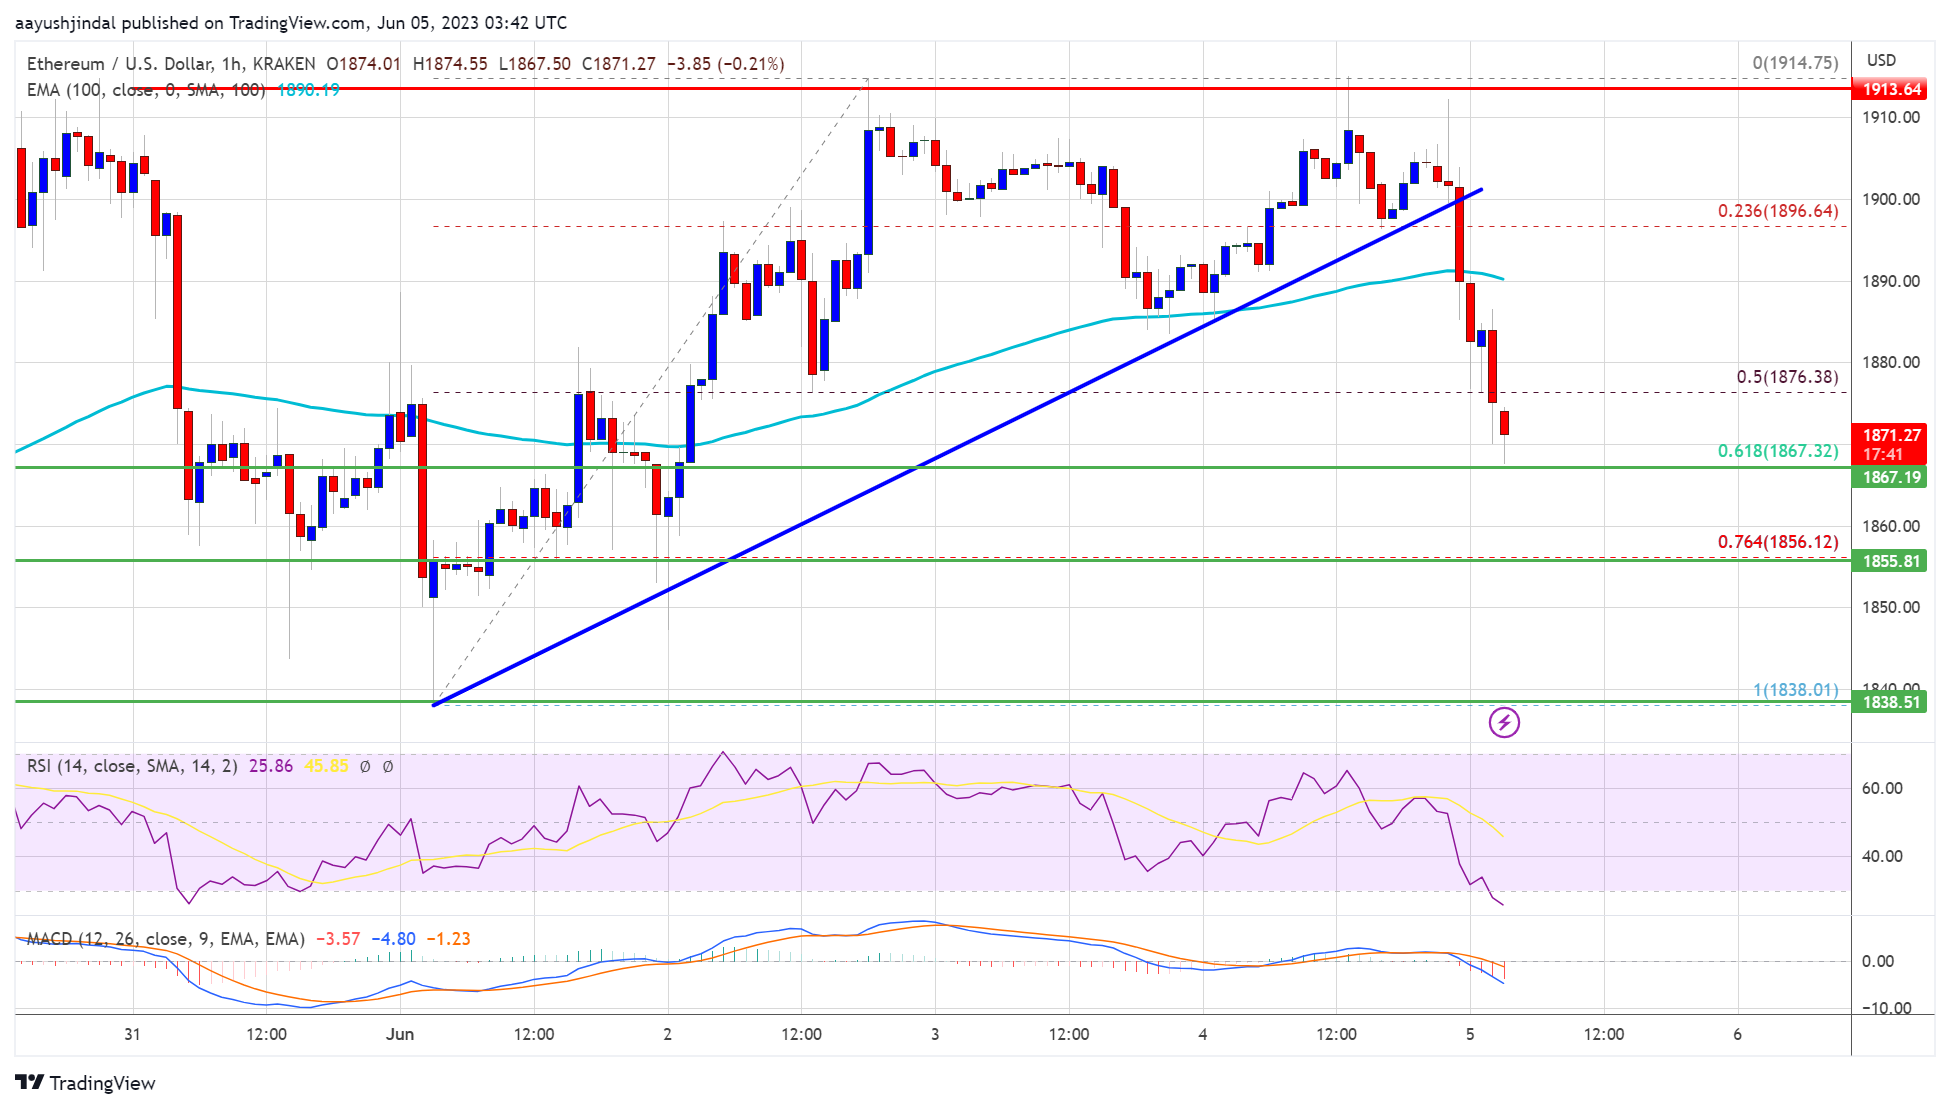
Source: ETHUSD on TradingView.com
The next resistance sits near $1,965, above which Ethereum could rise toward $2,000. Any more gains above the $2,000 resistance zone might send the price toward the $2,120 resistance.
More Losses in ETH?
If Ethereum fails to clear the $1,900 resistance, it could continue to move down. Initial support on the downside is near the $1,868 level.
The next major support is near the $1,855 zone. If there is a break below the $1,855 support, the price could decline toward the $1,840 support. Any more losses may perhaps send the price toward the $1,800 level or even $1,740 in the coming sessions.
Technical Indicators
Hourly MACD – The MACD for ETH/USD is gaining momentum in the bearish zone.
Hourly RSI – The RSI for ETH/USD is below the 50 level.
Major Support Level – $1,840
Major Resistance Level – $1,900
- SEO Powered Content & PR Distribution. Get Amplified Today.
- PlatoAiStream. Web3 Data Intelligence. Knowledge Amplified. Access Here.
- Minting the Future w Adryenn Ashley. Access Here.
- Buy and Sell Shares in PRE-IPO Companies with PREIPO®. Access Here.
- Source: https://www.newsbtc.com/analysis/eth/ethereum-price-rejections-1920/
- :is
- 000
- 50
- a
- above
- After
- against
- also
- and
- Another
- any
- At
- attempted
- average
- bearish
- Bears
- below
- besides
- Break
- Bullish
- Chart
- clear
- coming
- continue
- could
- data
- Decline
- Dollar
- down
- downside
- ETH
- ETH/USD
- Ether
- ethereum
- Ethereum Price
- Even
- faces
- fails
- For
- fresh
- fresh increase
- from
- further
- Gain
- gaining
- Gains
- High
- However
- HTTPS
- if
- immediate
- in
- Increase
- initial
- IT
- Key
- Kraken
- Level
- levels
- Line
- losses
- Low
- MACD
- major
- max-width
- May..
- might
- Momentum
- more
- move
- moving
- moving average
- multiple
- Near
- NewsBTC
- next
- now
- of
- on
- or
- pair
- perhaps
- plato
- Plato Data Intelligence
- PlatoData
- price
- proper
- pushed
- Resistance
- retracement
- Rise
- Risk
- rsi
- send
- sessions
- similar
- Simple
- sits
- started
- Struggling
- support
- support level
- Swing
- Testing
- The
- There.
- to
- toward
- Trading
- TradingView
- Trend
- upward
- us
- US Dollar
- via
- was
- which
- with
- zephyrnet