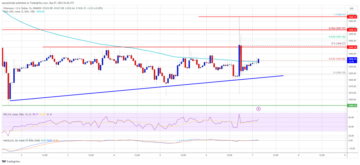
Ethereum price is attempting a recovery wave from $1,565 against the US Dollar. ETH could struggle to recover above $1,600 and might resume its decline.
- Ethereum is slowly moving higher toward the $1,600 resistance zone.
- The price is trading below $1,600 and the 100-hourly Simple Moving Average.
- There is a major bearish trend line forming with resistance near $1,595 on the hourly chart of ETH/USD (data feed via Kraken).
- The pair could start a fresh decline if it fails to clear the $1,600 resistance zone.
Ethereum Price Struggles Below $1,600
Ethereum’s price started a fresh decline below the $1,620 and $1,600 levels. ETH even declined to a new weekly low below the $1,580 level, unlike Bitcoin.
It traded as low as $1,565 and recently started a short-term upside correction. There was a move above the $1,580 level. The price climbed above the 50% Fib retracement level of the recent drop from the $1,600 swing high to the $1,565 low.
However, the bears are still active near the $1,600 resistance. The price is struggling to clear the 76.4% Fib retracement level of the recent drop from the $1,600 swing high to the $1,565 low.
Ether is now trading below $1,600 and the 100-hourly Simple Moving Average. There is also a major bearish trend line forming with resistance near $1,595 on the hourly chart of ETH/USD. On the upside, the price might face resistance near the $1,595 level.
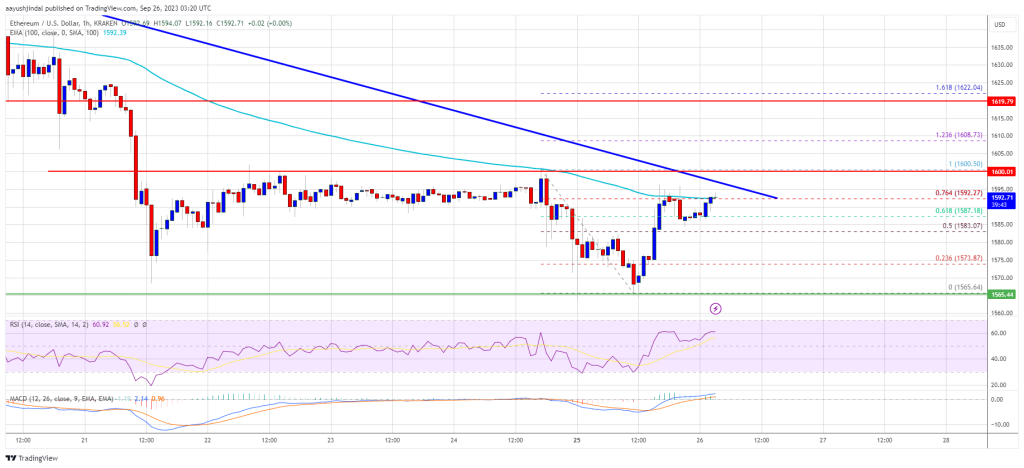
Source: ETHUSD on TradingView.com
The next major resistance is $1,600. A push above $1,600 might send Ethereum toward $1,620. If the bulls succeed in clearing the $1,620 hurdle, the price could start a decent increase toward the $1,650 resistance. Any more gains might open the doors for a move toward $1,700.
More Losses in ETH?
If Ethereum fails to clear the $1,600 resistance, it could start another decline. Initial support on the downside is near the $1,580 level.
The next key support is $1,565, below which the price could test the $1,540 support. A downside break below $1,540 might push the price further into a bearish zone. In the stated case, there could be a drop toward the $1,500 level.
Technical Indicators
Hourly MACD – The MACD for ETH/USD is losing momentum in the bearish zone.
Hourly RSI – The RSI for ETH/USD is now above the 50 level.
Major Support Level – $1,565
Major Resistance Level – $1,600
- SEO Powered Content & PR Distribution. Get Amplified Today.
- PlatoData.Network Vertical Generative Ai. Empower Yourself. Access Here.
- PlatoAiStream. Web3 Intelligence. Knowledge Amplified. Access Here.
- PlatoESG. Carbon, CleanTech, Energy, Environment, Solar, Waste Management. Access Here.
- PlatoHealth. Biotech and Clinical Trials Intelligence. Access Here.
- Source: https://www.newsbtc.com/analysis/eth/ethereum-price-uphill-task-1600/
- :is
- 1
- 50
- 500
- 700
- a
- above
- active
- against
- also
- and
- Another
- any
- ARE
- AS
- At
- attempting
- average
- BE
- bearish
- Bears
- below
- Break
- Bulls
- but
- case
- Chart
- clear
- Clearing
- Climbed
- could
- data
- Decline
- Dollar
- doors
- downside
- Drop
- ETH
- ETH/USD
- ethereum
- Ethereum Price
- Even
- Face
- faces
- fails
- For
- fresh
- from
- further
- Gains
- High
- higher
- hints
- HTTPS
- if
- in
- Increase
- initial
- into
- IT
- ITS
- Key
- Kraken
- Level
- levels
- Line
- losing
- losses
- Low
- MACD
- major
- max-width
- might
- Momentum
- more
- move
- moving
- moving average
- Near
- New
- NewsBTC
- next
- now
- of
- on
- open
- pair
- plato
- Plato Data Intelligence
- PlatoData
- potential
- price
- Push
- recent
- recently
- Recover
- recovery
- Resistance
- resume
- retracement
- rsi
- send
- short-term
- Simple
- Slowly
- start
- started
- stated
- Still
- Struggle
- Struggles
- Struggling
- succeed
- support
- support level
- Swing
- Task
- test
- The
- There.
- to
- toward
- traded
- Trading
- TradingView
- Trend
- unlike
- Upside
- us
- US Dollar
- via
- was
- Wave
- weekly
- which
- with
- zephyrnet