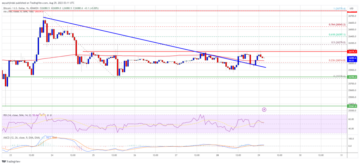
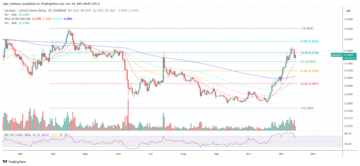
Ethereum is attempting an upside break above the $1,230 resistance against the US Dollar. ETH could start a strong increase if it settles above the $1,230 and $1,250 resistance levels.
- Ethereum tested the $1,180 level and climbed higher sharply.
- The price is now trading above $1,200 and the 100 hourly simple moving average.
- There was a break above a key contracting triangle with resistance near $1,215 on the hourly chart of ETH/USD (data feed via Kraken).
- The pair could gain bullish momentum if there is a clear move above $1,230 and $1,250.
Ethereum Price Eyes Fresh Rally
Ethereum price started a downside correction from the $1,230 resistance zone. ETH spiked below the $1,200 support zone and the 100 hourly simple moving average.
However, the bulls were active above the $1,160 support zone. A low was formed near $1,180 and the price climbed higher sharply, similar to bitcoin. There was a strong move above the $1,200 level. Besides, there was a break above a key contracting triangle with resistance near $1,215 on the hourly chart of ETH/USD.
Ether price is now trading above $1,200 and the 100 hourly simple moving average. It is now trading just below the 23.6% Fib retracement level of the recent wave from the $1,180 swing low to $1,237 high.
An immediate resistance is near the $1,230 level. The next major resistance is near the $1,250 level. A clear upside break above the $1,250 resistance could start a strong upward move. In the stated case, the price may perhaps rise towards the $1,300 resistance.

Source: ETHUSD on TradingView.com
The next major resistance could be $1,350. If the bulls clear the $1,350 resistance, the price might rise towards $1,400. Any more gains might send the price towards the $1,500 resistance zone.
Fresh Drop in ETH?
If ethereum fails to climb above the $1,250 resistance, it could start another drop. An initial support on the downside is near the $1,210 level and the 100 hourly simple moving average.
The next major support is near the $1,200 level. It is close to the 61.8% Fib retracement level of the recent wave from the $1,180 swing low to $1,237 high. A downside break below $1,200 might spark a move towards the $1,150 support. Any more losses could lead the price towards the $1,100 zone.
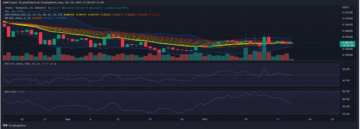
Technical Indicators
Hourly MACD – The MACD for ETH/USD is now losing momentum in the bullish zone.
Hourly RSI – The RSI for ETH/USD is now above the 50 level.
Major Support Level – $1,200
Major Resistance Level – $1,230
- SEO Powered Content & PR Distribution. Get Amplified Today.
- Platoblockchain. Web3 Metaverse Intelligence. Knowledge Amplified. Access Here.
- Source: https://newsbtc.com/analysis/eth/ethereum-price-key-trend-1250/
- 100
- a
- above
- active
- against
- and
- Another
- attempting
- average
- below
- Break
- Bullish
- Bulls
- case
- Chart
- clear
- climb
- Climbed
- Close
- contracting
- could
- data
- Dollar
- downside
- Drop
- ETH
- ETH/USD
- ethereum
- Ethereum Price
- Eyes
- fails
- formed
- fresh
- from
- Gain
- Gains
- High
- higher
- HTTPS
- immediate
- in
- Increase
- initial
- IT
- Key
- Kraken
- lead
- Level
- levels
- losing
- losses
- Low
- MACD
- major
- max-width
- might
- Momentum
- more
- move
- moving
- moving average
- Near
- next
- perhaps
- plato
- Plato Data Intelligence
- PlatoData
- price
- recent
- recovery
- Resistance
- retracement
- Rise
- rsi
- settles
- similar
- Simple
- Spark
- start
- started
- stated
- strong
- support
- support level
- SWIFT
- The
- to
- towards
- Trading
- TradingView
- Trend
- Upside
- upward
- us
- US Dollar
- via
- Wave
- zephyrnet