Published 19 hours ago
Ethereum Price Prediction: The ongoing correction phase is Ethereum price is led by a falling channel pattern. In the four-hour time chart, the series of new lower lows indicates the coin price is experiencing a steady downfall. Though the pattern seems to be carrying a downtrend, its technical setup is meant to offer a strong long opportunity upon the breakout of its resistance trendline.
advertisement
Key Points:
- The Ethereum price may continue its ongoing correction until the channel pattern is intact
- A bullish breakout from the channel patterns resistance trendline may recuperate bullish momentum to resume the prior uptrend
- The intraday trading volume in Ether is $10.8 billion, indicating an 18% gain.
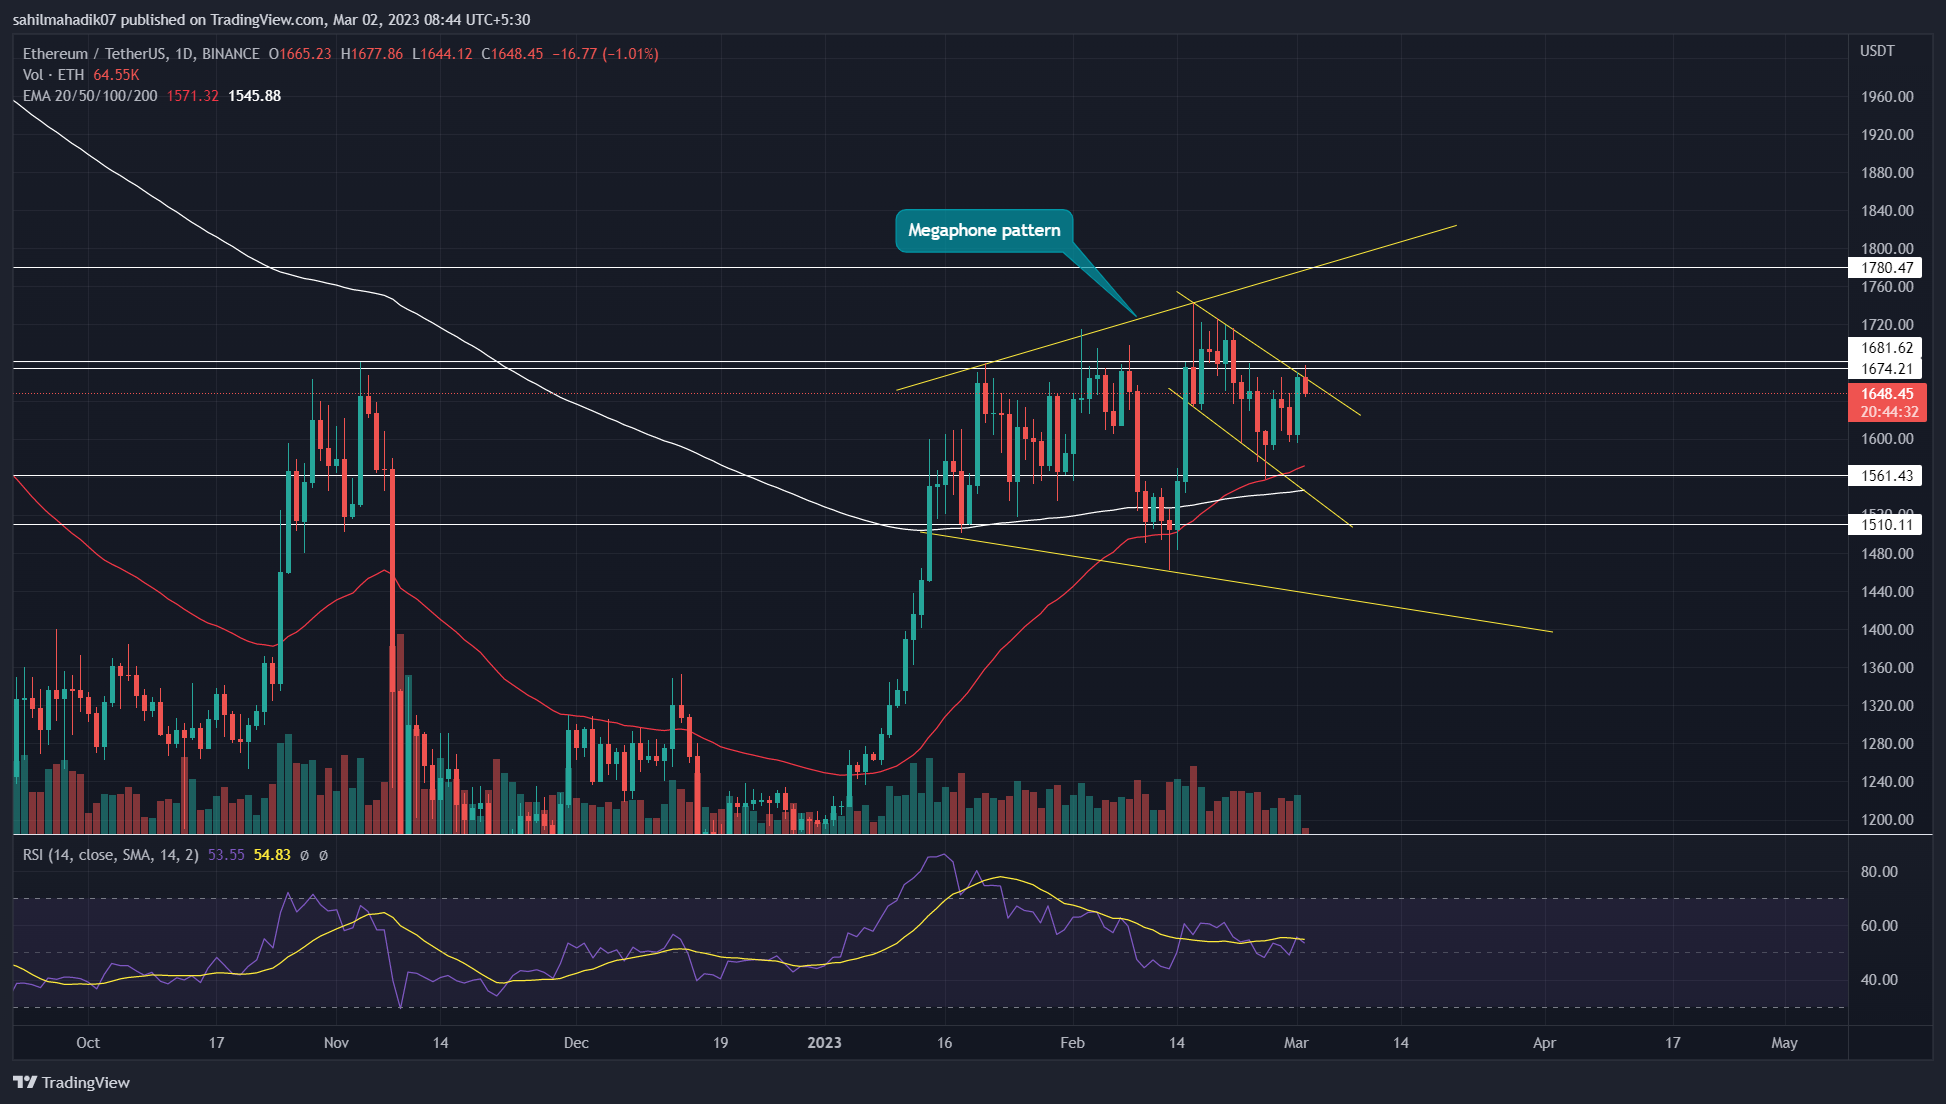
Source- Tradingview
In our previous articles, we mentioned the formation of a megaphone pattern, in Ethereum’s daily time frame chart. Under the influence of this pattern, the coin is forming higher price swings indicating increasing volatility in the market.
Anyhow, the ETH price recently reverted from this pattern resistance trendline and initiated a new bear cycle. Thus, the ongoing correction wobbling between the two trendlines revealed a falling channel pattern.
Trending Stories
Also Read: Top 5 NFT Game Development Companies You Need To Know About
Ethereum Price Prediction: Channel Pattern Breakdown May Resume ETH’s Prior Recovery Rally.
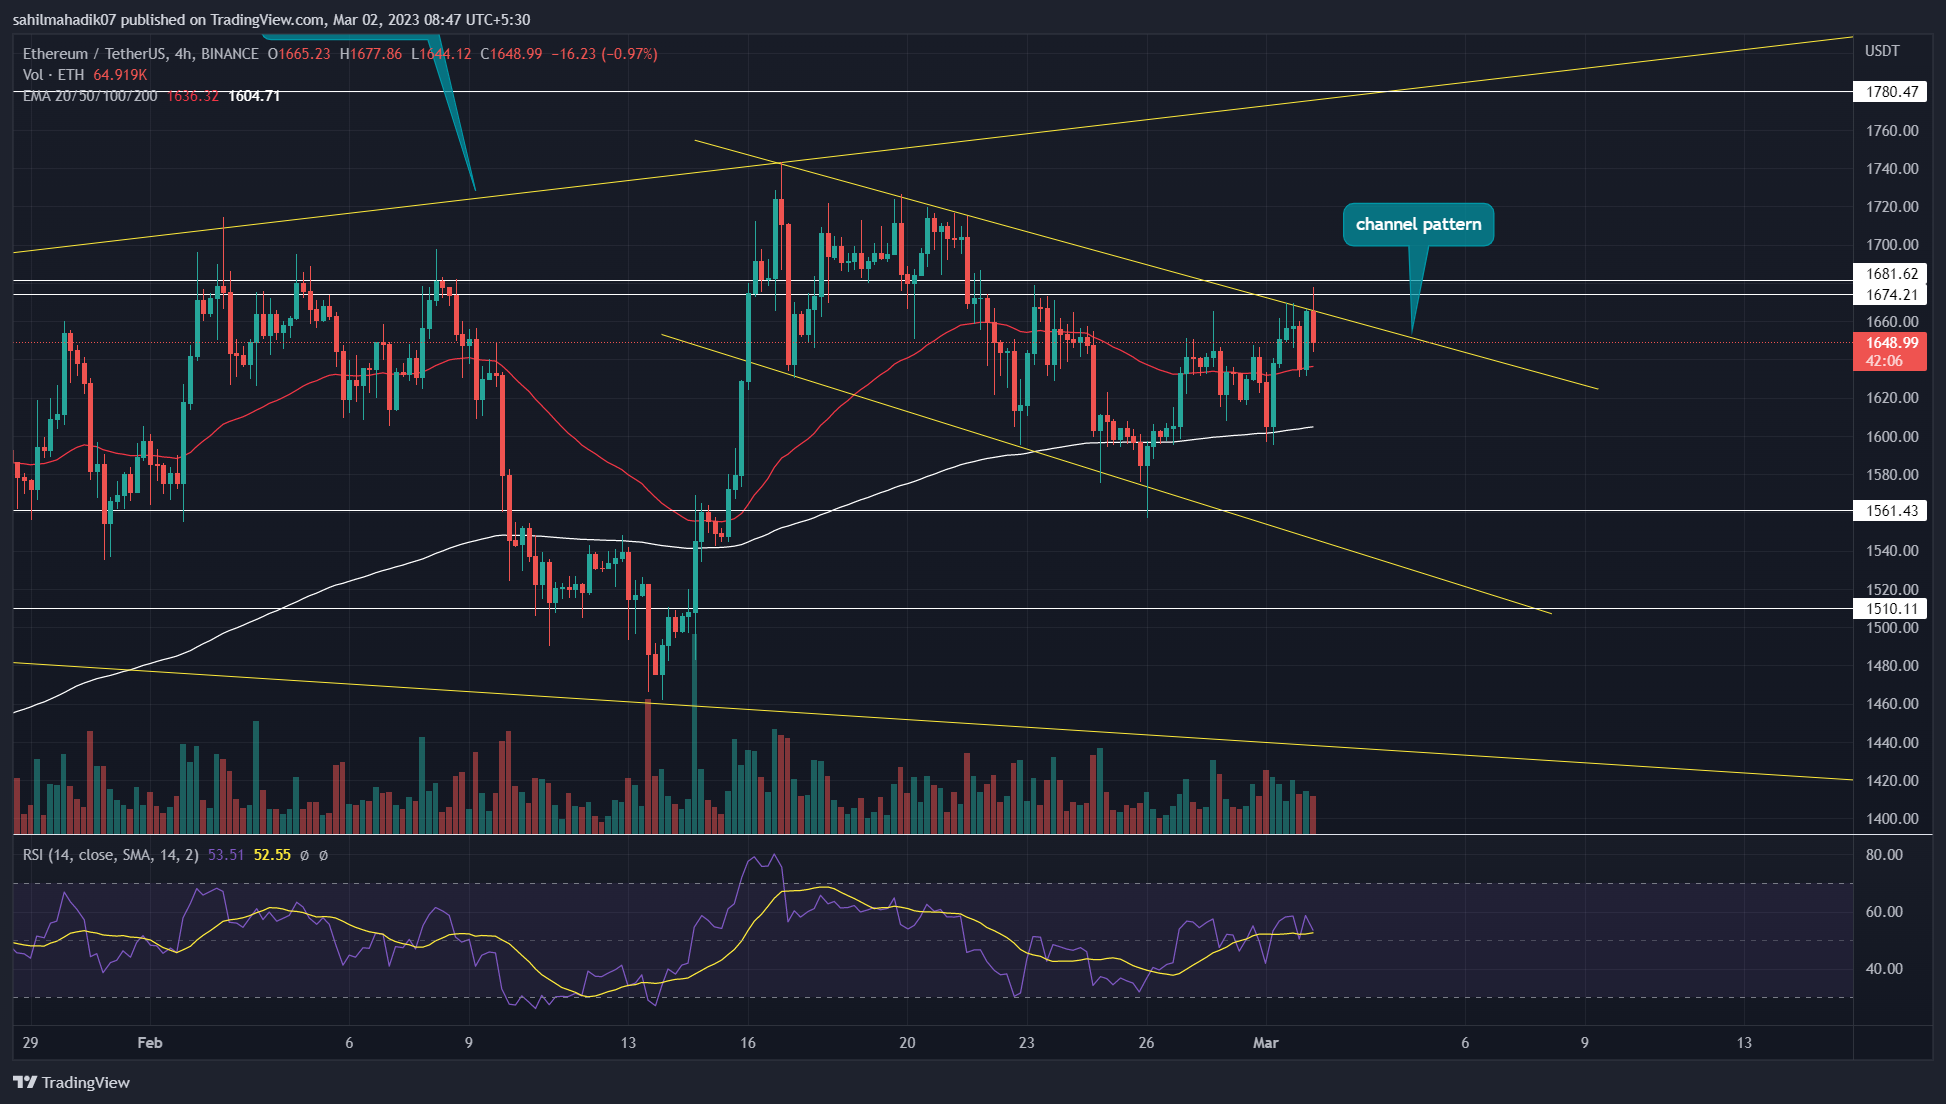
Source- Tradingview
Today, the Ethereum price is down 0.88% and shows rejection candles and decreasing volume at the overhead trendline, indicating a higher chance of bearish reversal. With sustained selling, the altcoin may drop 6.5% down to meet the lower support trendline.
However, the most common outcome of this pattern is a strong directional rally upon the breakout from its resistance trendline. Thus, a potential breakout from the overhead trendline will accelerate the buying pressure and drive the prices back to the last swing high resistance of $1720.
Moreover, the buying pressure intensified from channel breakout could also assist buyers to complete the aforementioned megaphone pattern on a bullish note.
Technical Indicator
RSI: The daily RSI slope moving around the midline indicates the market sentiment neutral.
advertisement
EMAs: the 50-day EMA slope acts as a dynamic support to the Ethereum coin price
Ethereum Coin Price Intraday Levels-
- Spot rate: $1559
- Trend: Bullish
- Volatility: Medium
- Resistance level- $1680 and $1780
- Support level- $1560 and $1510
Share this article on:
advertisement
The presented content may include the personal opinion of the author and is subject to market condition. Do your market research before investing in cryptocurrencies. The author or the publication does not hold any responsibility for your personal financial loss.
<!– Close Story–>
- SEO Powered Content & PR Distribution. Get Amplified Today.
- Platoblockchain. Web3 Metaverse Intelligence. Knowledge Amplified. Access Here.
- Source: https://coingape.com/markets/ethereum-price-prediction-heres-how-you-can-trade-ongoing-correction-in-eth/
- 1
- 10
- 7
- 9
- a
- accelerate
- acts
- Ad
- Altcoin
- and
- around
- article
- articles
- assist
- author
- avatar
- back
- banner
- Bear
- bearish
- Beauty
- before
- between
- Billion
- blockchain
- Breakdown
- breakout
- Brian
- Bullish
- buyers
- Buying
- carrying
- Chance
- Channel
- Chart
- Coin
- Coingape
- COM
- Common
- Companies
- complete
- condition
- content
- continue
- correction phase
- could
- cryptocurrencies
- cryptocurrency
- cycle
- daily
- Development
- different
- down
- downfall
- drive
- Drop
- dynamic
- Entertainment
- ETH
- eth price
- Ether
- Ether (ETH)
- ethereum
- Ethereum Price
- Ethereum price prediction
- Ethereum's
- experiencing
- Falling
- Fashion
- finance
- financial
- follow
- formation
- FRAME
- from
- Gain
- game
- High
- higher
- hold
- HOURS
- How
- HTTPS
- in
- include
- Including
- increasing
- indicates
- influence
- investing
- journalism
- Know
- Last
- Led
- Long
- loss
- Lows
- Market
- market research
- market sentiment
- Meet
- mentioned
- Momentum
- most
- moving
- Need
- Neutral
- New
- NFT
- offer
- ongoing
- Opinion
- Opportunity
- Outcome
- past
- Pattern
- patterns
- personal
- phase
- plato
- Plato Data Intelligence
- PlatoData
- plugin
- points
- potential
- prediction
- presented
- pressure
- previous
- previous articles
- price
- Price Prediction
- Prices
- Prior
- Publication
- rally
- Rate
- Read
- recently
- recovery
- research
- Resistance
- responsibility
- resume
- Revealed
- Reversal
- seems
- Selling
- sentiment
- Series
- setup
- Share
- Shows
- Slope
- steady
- strong
- subject
- support
- sustained
- Swings
- Technical
- The
- time
- to
- Topics
- trade
- Trading
- trading volume
- TradingView
- trending
- under
- variety
- Volatility
- volume
- will
- working
- written
- years
- Your
- zephyrnet