Ethereum price is recovering above $1,700 against the US Dollar. ETH could continue to move up if it clears the $1,780 resistance zone.
- Ethereum was able to climb above the $1,700 and $1,720 resistance levels.
- The price is trading above $1,700 and the 100-hourly Simple Moving Average.
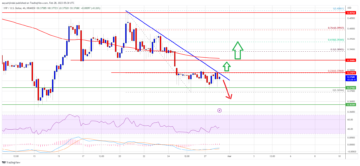
- There was a break above a major bearish trend line with resistance near $1,720 on the hourly chart of ETH/USD (data feed via Kraken).
- The pair could rise further above the $1,750 and $1,780 resistance levels.
Ethereum Price Attempts Recovery
Ethereum’s price was able to form a support base above the $1,620 level. ETH started a decent recovery wave above the $1,680 and $1,700 resistance levels, similar to Bitcoin.
Besides, there was a break above a major bearish trend line with resistance near $1,720 on the hourly chart of ETH/USD. The bulls even pushed the price above the $1,750 resistance and the 100-hourly Simple Moving Average. It tested the $1,770 level. A high is formed near $1,768 and the price is now correcting gains.
There was a move below the $1,750 level. Ether dipped below the 23.6% Fib retracement level of the upward move from the $1,620 swing low to the $1,768 high.
It is now trading above $1,700 and the 100-hourly Simple Moving Average. Immediate resistance is near the $1,740 level. The next major resistance is near the $1,770 level.
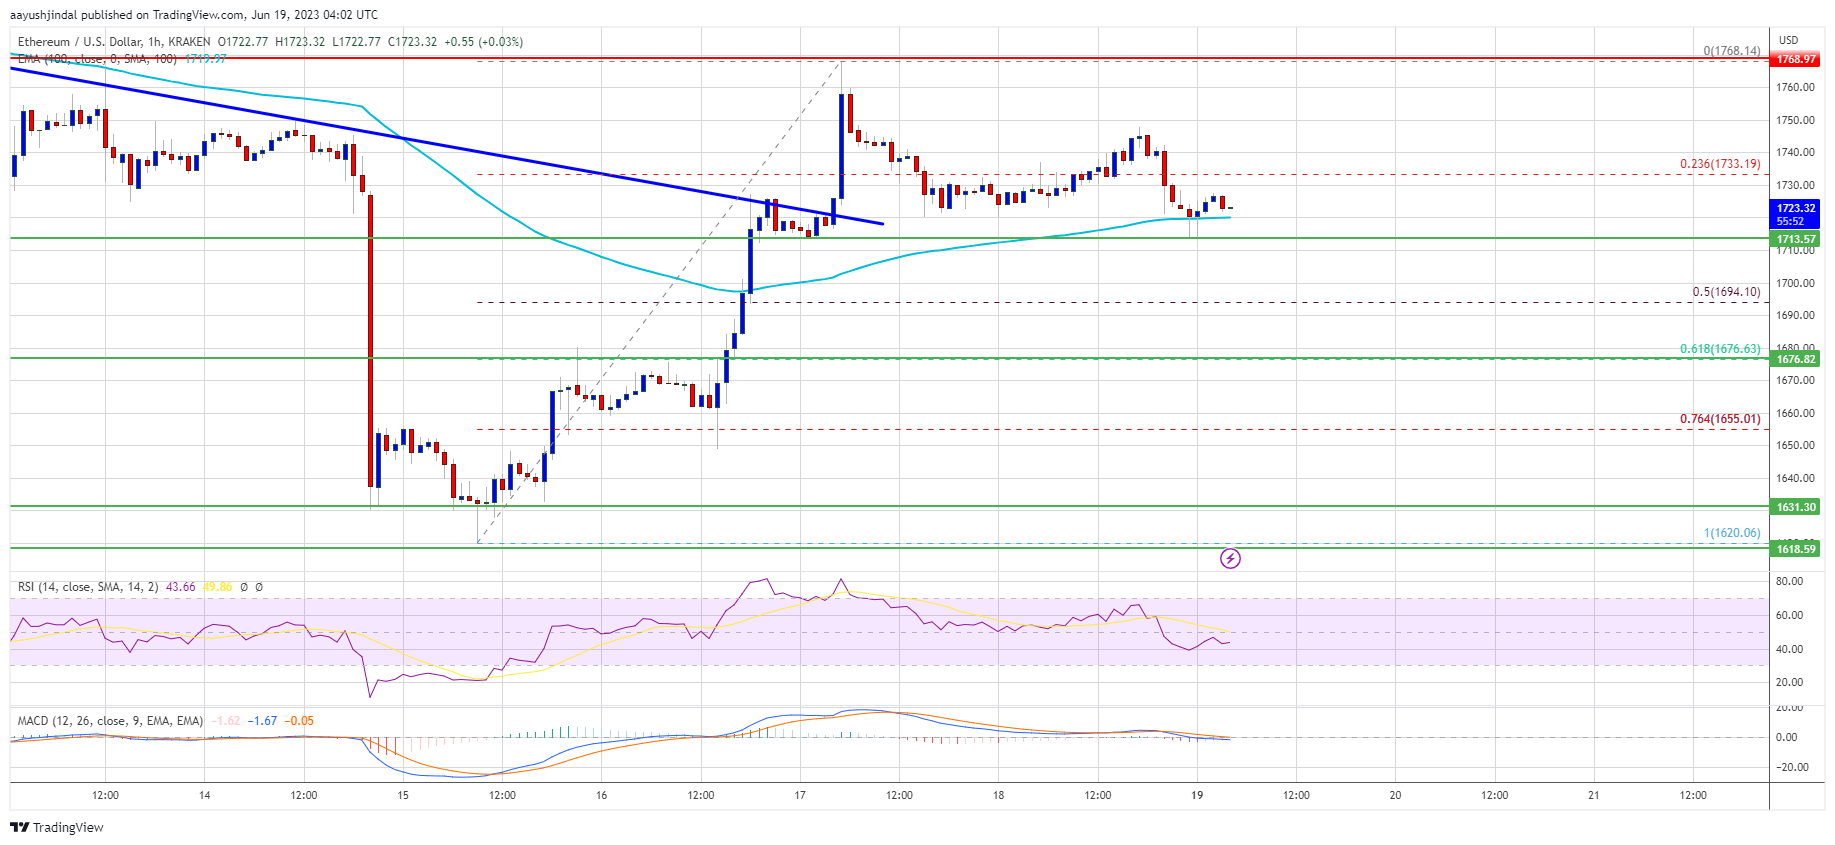
Source: ETHUSD on TradingView.com
The main resistance is near $1,780. A proper move above the $1,770 and $1,780 resistance levels might start a steady recovery wave. The next resistance sits near $1,820, above which Ethereum could rise toward the $1,850 level. Any more gains above the $1,850 resistance zone might send the price toward the $1,920 resistance.
Fresh Decline in ETH?
If Ethereum fails to clear the $1,780 resistance, it could start another decline. Initial support on the downside is near the $1,710 level.
The next major support is near the $1,675 level or the 61.8% Fib retracement level of the upward move from the $1,620 swing low to the $1,768 high. If there is a break and close below the $1,675 support, the price could dive toward the $1,620 support. Any more losses may perhaps send the price toward the $1,550 zone.
Technical Indicators
Hourly MACD – The MACD for ETH/USD is losing momentum in the bullish zone.
Hourly RSI – The RSI for ETH/USD is now below the 50 level.
Major Support Level – $1,675
Major Resistance Level – $1,780
- SEO Powered Content & PR Distribution. Get Amplified Today.
- EVM Finance. Unified Interface for Decentralized Finance. Access Here.
- Quantum Media Group. IR/PR Amplified. Access Here.
- PlatoAiStream. Web3 Data Intelligence. Knowledge Amplified. Access Here.
- Source: https://www.newsbtc.com/analysis/eth/ethereum-price-bullish-above-1780/
- :is
- $UP
- 23
- 50
- 710
- a
- Able
- above
- against
- and
- Another
- any
- Attempts
- average
- base
- bearish
- below
- Break
- Bullish
- Bulls
- Chart
- clear
- climb
- Close
- continue
- could
- critical
- data
- Decline
- Dollar
- downside
- ETH
- ETH/USD
- Ether
- ethereum
- Ethereum Price
- Even
- fails
- For
- form
- formed
- from
- further
- Gains
- High
- HTTPS
- if
- immediate
- in
- initial
- IT
- Kraken
- Level
- levels
- Line
- losing
- losses
- Low
- MACD
- Main
- major
- max-width
- May..
- might
- Momentum
- more
- move
- moving
- moving average
- Near
- NewsBTC
- next
- now
- of
- on
- or
- pair
- Pattern
- perhaps
- plato
- Plato Data Intelligence
- PlatoData
- price
- prints
- proper
- pushed
- recovering
- recovery
- Resistance
- retracement
- Rise
- rsi
- send
- similar
- Simple
- sits
- start
- started
- steady
- support
- support level
- Swing
- Technical
- tested
- The
- There.
- to
- toward
- Trading
- TradingView
- Trend
- upward
- us
- US Dollar
- via
- was
- Wave
- which
- why
- with
- zephyrnet