Ethereum price recovered from the $1,985 zone. ETH is showing positive signs and might rise further if it clears the $2,075 resistance.
- Ethereum is recovering higher from the $1,985 zone.
- The price is trading above $2,040 and the 100-hourly Simple Moving Average.
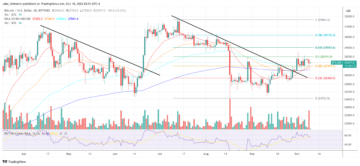
- There was a break above a key bearish trend line with resistance near $2,040 on the hourly chart of ETH/USD (data feed via Kraken).
- The pair could gain bullish momentum if it stays above the 100-hourly Simple Moving Average.
Ethereum Price Eyes Fresh Increase
Ethereum price spiked before the $2,000 support before the bulls appeared. ETH traded as low as $1,986 and recently started a recovery wave, like Bitcoin.
There was a decent increase above the $2,020 level. The price climbed above the 23.6% Fib retracement level of the downward move from the $2,132 swing high to the $1,986 low. Besides, there was a break above a key bearish trend line with resistance near $2,040 on the hourly chart of ETH/USD.
Ethereum is now trading above $2,040 and the 100-hourly Simple Moving Average. On the upside, the price is facing resistance near the $2,075 zone. It is close to the 61.8% Fib retracement level of the downward move from the $2,132 swing high to the $1,986 low.
The first key resistance is near the $2,100 level. The next resistance sits at $2,130. A clear move above the $2,130 level could send the price toward the $2,150 resistance zone.

Source: ETHUSD on TradingView.com
The next resistance is near $2,220, above which the price could aim for a move toward the $2,265 level. Any more gains could start a wave toward the $2,320 level.
Another Decline in ETH?
If Ethereum fails to clear the $2,075 resistance, it could start a fresh decline. Initial support on the downside is near the $2,045 level and the 100-hourly Simple Moving Average, below which the bears might gain strength.
The next key support is $2,000. A downside break below $2,000 might spark a strong bearish move. The key support is now at $1,930, below which there is a risk of a move toward the $1,880 level in the near term.
Technical Indicators
Hourly MACD – The MACD for ETH/USD is losing momentum in the bullish zone.
Hourly RSI – The RSI for ETH/USD is now above the 50 level.
Major Support Level – $2,045
Major Resistance Level – $2,075
- SEO Powered Content & PR Distribution. Get Amplified Today.
- PlatoData.Network Vertical Generative Ai. Empower Yourself. Access Here.
- PlatoAiStream. Web3 Intelligence. Knowledge Amplified. Access Here.
- PlatoESG. Carbon, CleanTech, Energy, Environment, Solar, Waste Management. Access Here.
- PlatoHealth. Biotech and Clinical Trials Intelligence. Access Here.
- Source: https://www.newsbtc.com/analysis/eth/ethereum-price-recovers-2075/
- :is
- 000
- 1
- 100
- 130
- 150
- 220
- 23
- 320
- 50
- a
- above
- aim
- and
- any
- appeared
- AS
- At
- average
- bearish
- Bears
- before
- below
- besides
- Break
- Bullish
- Bulls
- Chart
- clear
- Climbed
- Close
- could
- data
- Decline
- downside
- downward
- ETH
- ETH/USD
- ethereum
- Ethereum Price
- Eyes
- facing
- fails
- First
- For
- fresh
- fresh increase
- from
- further
- Gain
- Gains
- High
- higher
- HTTPS
- if
- in
- Increase
- initial
- IT
- Key
- key resistance
- Kraken
- Level
- like
- Line
- losing
- Low
- MACD
- max-width
- might
- Momentum
- more
- move
- moving
- moving average
- Near
- NewsBTC
- next
- now
- of
- on
- pair
- plato
- Plato Data Intelligence
- PlatoData
- positive
- price
- recently
- recovering
- Recovers
- recovery
- Resistance
- retracement
- Rise
- Risk
- rsi
- send
- showing
- Signs
- Simple
- sits
- SMA
- Spark
- start
- started
- strength
- strong
- support
- support level
- Swing
- term
- The
- There.
- to
- toward
- traded
- Trading
- TradingView
- Trend
- Upside
- via
- was
- Wave
- which
- why
- with
- zephyrnet