Talking Points
US Consumer Price Index – US CPI
US Retail Sales
EUR/USD Daily Chart – Technical Analysis
USD/JPY Daily Chart – Technical Analysis
USD/CAD Weekly Chart – Technical Analysis
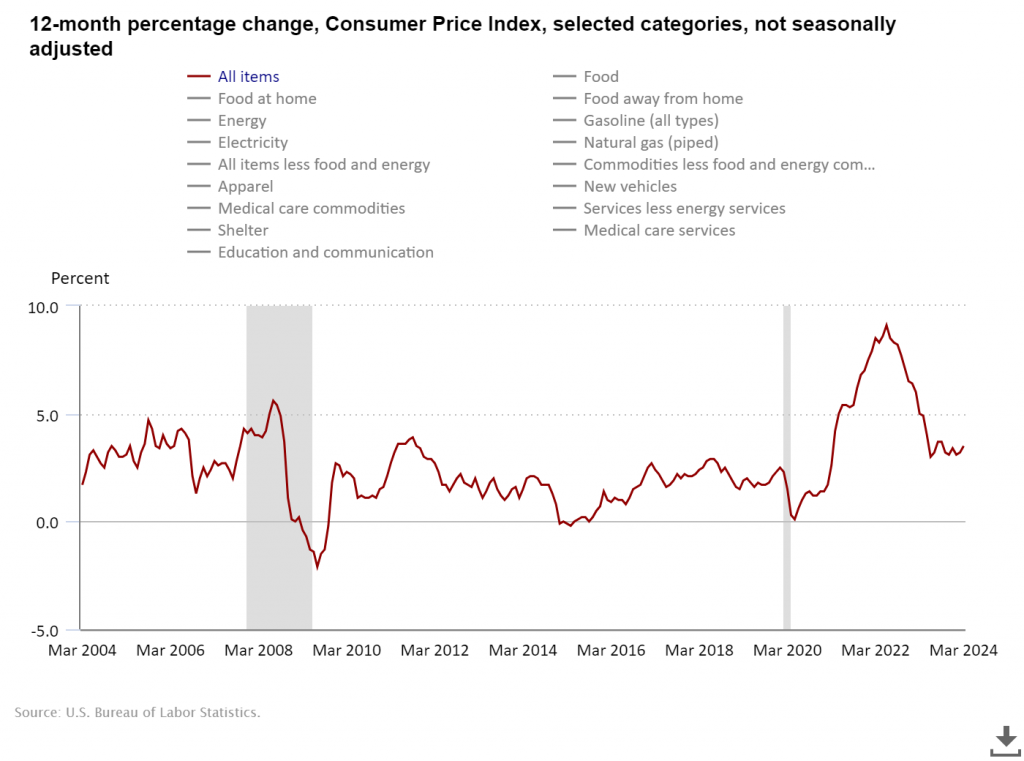
US Consumer Price Index – US CPI

The core CPI, which excludes Energy and food products, came in at 3.8% in March, slightly higher than 3.75% in February 2004. The uptick was mainly driven again by a rise in the cost of services. The increase in the cost of the transportation services sector was mainly driven by an increase in Motor Vehicle Insurance, Public transportation costs, and Motor vehicle Maintenance and Repairs. Medical Services rose due to increased Health Insurance, Hospitals, and Related Services. The FED’s preferred inflation gauge, the Core PCE Price Index, for the same duration, reflects a similar picture as the CPI; therefore, there may not be much change in CPI numbers expected for this week compared to last month.
US Retail Sales
The US Retail Sales trend remains healthy; removing the pandemic era with its outliers, it remains within its 10-year average, and the components with the most index weight remained healthy over the past three years. Non-store Retailers and general merchandise stores continued to improve over the same duration. The more volatile contributors, motor vehicle and parts dealers, food services, and drinking places, remained within their 10-year average ranges.
According to Bloomberg Analysts surveys, April’s US Retail Sales MoM is expected to increase by 0.4% compared to 0.7% prior and less than February by 0.9%. (Revised from 0.6%). Core Retail Sales M/M are expected to increase by just 0.2% compared to 1.1% prior and less than February’s 0.6%. (Revised from 0.3%) A review of the March 2024 Retail Sales figures revealed that while consumer spending grew by 0.7% compared to 0.9% prior, consumers have scaled back on long-term purchases, a behavior possibly influenced by the specter of high interest rates. Looking ahead, the April 2024 Retail Sales figures are of significant interest. These figures, which are expected to show a slight decrease in the M/M change and steady Y/Y growth, will provide crucial insights into the trajectory of consumer spending and its potential impact on economic performance.
The latest CPI readings for March rose by 3.47% compared to 3.15% for February 2024, primarily driven by the “Cost of services” inflation category. Higher oil prices and a slight uptick in energy prices were the main culprits behind the higher CPI number for March 2024.
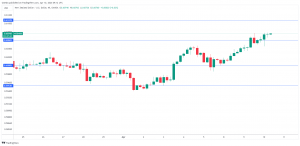
EUR/USD Daily Chart – Technical Analysis

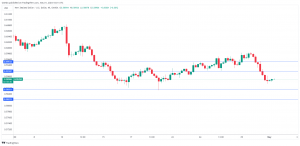
- Price action has been trading within a narrowing range, as marked by the green lines on the chart. It is currently attempting a break above the upper border of the formation. Weekly and monthly resistance lies just above price action within the range of 1.0830 – 1.0836.
- The price broke above its fast EMA9, MA9, and intermediate MA20. The moving averages’ intersection below price action has become a confluence of support near the weekly pivot of 1.0760.
- Non-smoothed RSI7 is in line with price action and is currently overbought.
Weekly Chart Update
- Price action broke and remained below the lower border of an ascending channel; the pullback discussed last time has returned to the previously broken trendline.
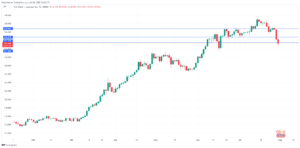
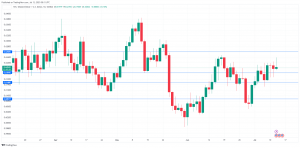
USD/JPY Daily Chart – Technical Analysis

- The USD/JPY price has demonstrated remarkable resilience, maintaining an extended uptrend for over ten years. The blue lines on the chart mark the latter part of the uptrend, which was influenced by the USA’s and Japan’s fundamental economies.
- Price action was trading within an ascending channel; it broke below the channel’s lower border during late 2023. However, it has been attempting to re-enter the channel since the breakout.
- Following the latest Bank of Japan meeting, price action was able to break above the channel’s lower border and reenter. However, the break was met by fierce resistance represented by a strong bearish engulfing candle, which closed below the lower border by the end of the trading day.
- Price action is in a pullback mode. It is currently attempting to rent the channel; however, it finds resistance at the intersection of the channel’s lower border and R1 near 156.87.
- As marked on the chart, multiple standard calculation resistance levels exist within the channel.
- Price continues to trade above its fast and intermediate moving averages, EMA9, MA9, and MA21; the three averages intersect below the price action, forming a confluence of support near the 154.80 – 155.50 range.
- Fast RSI7 aligns with price action and is approaching overbought territory.
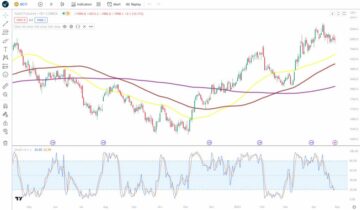
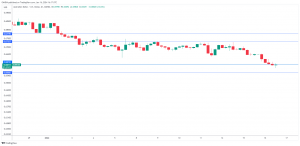
USD/CAD Weekly Chart – Technical Analysis

- Price action broke out above the upper border for the narrowing range marked by letter A on the weekly chart; price action has been attempting to break above this line for many weeks, and it did after the Bank of Canada kept interest rates on hold two weeks ago and as the US inflation data continued to come in higher.
- Price appreciation was met by resistance at its monthly R3 of 1.3830, forming a potential shortfall ahead of significant resistance marked by the blue line dating back to 2022.
- The throwback previously discussed has materialized, and the price currently finds support at the breakout level. Price action continues to trade above the breakout level.
- Price action is still trading above its EMA9 and MA50.
- The RSI is in line with price action and is currently near a neutral level.
Content is for general information purposes only. It is not investment advice or a solution to buy or sell securities. Opinions are the authors; not necessarily that of OANDA Business Information & Services, Inc. or any of its affiliates, subsidiaries, officers or directors. If you would like to reproduce or redistribute any of the content found on MarketPulse, an award winning forex, commodities and global indices analysis and news site service produced by OANDA Business Information & Services, Inc., please access the RSS feed or contact us at info@marketpulse.com. Visit https://www.marketpulse.com/ to find out more about the beat of the global markets. © 2023 OANDA Business Information & Services Inc.
Latest posts by Moheb Hanna (see all)
- SEO Powered Content & PR Distribution. Get Amplified Today.
- PlatoData.Network Vertical Generative Ai. Empower Yourself. Access Here.
- PlatoAiStream. Web3 Intelligence. Knowledge Amplified. Access Here.
- PlatoESG. Carbon, CleanTech, Energy, Environment, Solar, Waste Management. Access Here.
- PlatoHealth. Biotech and Clinical Trials Intelligence. Access Here.
- Source: https://www.marketpulse.com/newsfeed/eur-usd-usd-jpy-usd-cad-technical-analysis-overview-ahead-of-us-cpi-and-retail-sales/mhanna
- :has
- :is
- :not
- 1
- 15 years
- 15%
- 2%
- 2022
- 2023
- 2024
- 325
- 5
- 50
- 700
- 80
- 87
- a
- Able
- About
- above
- access
- Action
- advice
- affiliates
- After
- again
- ago
- ahead
- Aligns
- an
- analysis
- Analysts
- and
- any
- appreciation
- approaching
- April
- April 2024
- ARE
- AS
- ascending
- At
- attempting
- author
- authors
- avatar
- average
- award
- back
- Bank
- bank of canada
- bank of japan
- Bank of Japan meeting
- BE
- bearish
- beat
- become
- been
- behavior
- behind
- below
- Bloomberg
- Blue
- border
- both
- Box
- Break
- breakout
- Broke
- Broken
- business
- buy
- by
- calculation
- came
- Canada
- Category
- CFTE
- change
- Channel
- Chart
- client
- clients
- closed
- COM
- come
- Commentary
- Commodities
- compared
- components
- confluence
- consumer
- consumer price index
- Consumers
- contact
- content
- continued
- continues
- contributors
- Core
- Cost
- Costs
- CPI
- crucial
- Currently
- daily
- data
- Dating
- day
- dealers
- decrease
- demonstrated
- designation
- DID
- Directors
- discussed
- driven
- driving
- due
- duration
- during
- Economic
- economic performance
- economies
- end
- energy
- energy prices
- Era
- Ether (ETH)
- EUR/USD
- exist
- expected
- experience
- extended
- FAST
- February
- fierce
- Figures
- financial
- Financial institutions
- Find
- finds
- food
- For
- forex
- Forex markets
- formation
- forming
- found
- from
- fundamental
- gauge
- General
- Global
- global markets
- Globally
- Green
- grew
- Growth
- Have
- he
- Health
- health insurance
- healthy
- High
- higher
- hold
- holds
- hospitals
- However
- HTTPS
- if
- Impact
- improve
- in
- Inc.
- Increase
- increased
- index
- Indices
- inflation
- influenced
- information
- insights
- Institutional
- institutional clients
- institutions
- insurance
- interest
- Interest Rates
- Intermediate
- intersect
- intersection
- into
- investment
- IT
- ITS
- Japan
- Japan’s
- just
- kept
- Last
- Late
- latest
- latter
- less
- letter
- Level
- levels
- lies
- like
- Line
- lines
- long-term
- looking
- lower
- Main
- mainly
- maintaining
- maintenance
- many
- March
- March 2024
- mark
- marked
- Market
- Market Analysis
- MarketPulse
- Markets
- max-width
- May..
- medical
- meeting
- member
- merchandise
- met
- Mode
- mom
- Month
- monthly
- more
- most
- Motor
- moving
- moving averages
- much
- multiple
- Near
- necessarily
- Neutral
- news
- number
- numbers
- of
- officers
- Oil
- on
- only
- Opinions
- or
- out
- over
- overview
- pandemic
- part
- parts
- past
- pce
- performance
- photo
- picture
- Pivot
- Places
- plato
- Plato Data Intelligence
- PlatoData
- please
- possibly
- Posts
- potential
- preferred
- previously
- price
- PRICE ACTION
- Prices
- primarily
- Prior
- Produced
- Products
- provide
- public
- public transportation
- Publishing
- pullback
- purchases
- purposes
- R3
- range
- ranges
- Rates
- recognized
- Reenter
- reflects
- related
- relations
- remained
- remains
- remarkable
- removing
- Rent
- repairs
- represented
- research
- resilience
- Resistance
- retail
- Retail Sales
- retailers
- Revealed
- review
- Rise
- ROSE
- rsi
- rss
- sales
- sales figures
- same
- scaled
- sector
- Securities
- sell
- service
- Services
- sharing
- shortfall
- show
- Sides
- significant
- similar
- since
- site
- slight
- slightly
- solution
- specializes
- specter
- Spending
- standard
- steady
- Still
- stores
- strong
- subsidiaries
- support
- Technical
- Technical Analysis
- ten
- territory
- than
- that
- The
- The Weekly
- their
- There.
- therefore
- These
- this
- this week
- three
- time
- to
- top
- trade
- Trading
- trajectory
- transportation
- transportation services
- Trend
- two
- uptrend
- us
- US CPI
- us inflation
- US Retail Sales
- USD/CAD
- USD/JPY
- v1
- vehicle
- Visit
- volatile
- was
- week
- weekly
- Weeks
- weight
- were
- which
- while
- will
- winning
- with
- within
- worked
- would
- years
- you
- zephyrnet