February’s Finance Bridge examines the impact of Bitcoin ETF approvals, a surge in stablecoin supply, and emerging volatility trends. Essential insights for directional and momentum traders.


Your gateway to successful crypto investing guided by data and research
Executive Summary
- Monthly Overview: While the approval of new spot Bitcoin ETFs was an important moment from a narrative perspective, the heavy outflow of money from GBTC turned the approvals into a “sell-the-news” event. On the other hand, the broader altcoin market, led by Ethereum, exhibited resilience which may suggest a potential shift in capital flows.
- Market Momentum: Stablecoins market expansion suggests growing liquidity, which seems ripe to impact trades in the near future. Current cyclical analysis indicates early-stage market positioning, with a high possibility of trend continuation. At the same time, rising volatility in Bitcoin and Ethereum calls for caution.
- Metric Spotlight: Active Addresses offer insights into network activity and health, serving as a barometer for market sentiment and potential shifts in investor behaviour.
We’re excited to introduce a new, streamlined format in this February 2024 edition of Finance Bridge. Starting with the current issue, we will aim to deliver the essence of market dynamics and essential analytics in a format that is both more digestible and more actionable. We hope that with this renewed focus, we underscore the practical value of Glassnode data and on-chain analytics, particularly for momentum and directional traders, enabling swift and informed trading decisions.
Monthly Market Overview
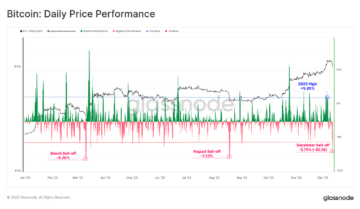
January witnessed a watershed moment for the cryptocurrency market with the historic approval and trading of new spot Bitcoin ETFs in the US. This landmark event has ushered in a wave of institutional capital, showcasing Bitcoin’s increasing acceptance in mainstream financial markets. Despite this, the market experienced a “sell-the-news” phenomenon, with Bitcoin prices experiencing heightened volatility, setting both new multi-year highs and lows within a short span. Such volatility presents unique opportunities for momentum and directional traders to capitalize on short-term market movements (Read more).
Ethereum (ETH) and Altcoins have rallied, with ETH outperforming Bitcoin for the first time since October 2022, indicating a possible shift in capital flows and an appetite for assets further out on the risk curve. The derivatives market for ETH has seen increased activity, hinting at a growing optimism for potential ETH ETF approvals despite regulatory challenges (Read more).
The market is also digesting the significant supply overhang from the Grayscale Bitcoin Trust (GBTC) conversion into an ETF. This event triggered substantial capital rebalancing, impacting market dynamics. Nonetheless, Bitcoin’s price resilience is evident, with the Realized Cap metric showing strong capital inflows, albeit at a slower recovery pace compared to previous cycles (Read more).
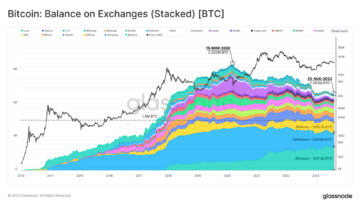
Institutional and large capital investors are making their presence felt, as evidenced by robust transfer volumes on-chain and significant exchange flows. These developments underscore a growing institutional interest in Bitcoin and suggest an expanding market participant base.
Stablecoins Market Dynamics
The stablecoin sector has experienced a significant increase in fiat inflows, with the total supply of USD-pegged tokens reaching $128.5 billion. This surge is predominantly fueled by Tether (USDT), which commands a 74.3% market share or $95.5 billion in dollar terms.

Cycle Navigation: A Macro Perspective
The cryptocurrency market appears to be in the initial stage of the typical three-phase cycle observed historically:
- Pre-Bull Phase: Currently, the market is navigating through the recovery interval that follows the cycle low, setting the stage for the next exponential rally.
- Euphoria Phase: This phase is characterized by a rally that surpasses the previous cycle’s all-time high (ATH), aiming for new heights.
- Post-ATH Phase: Following the establishment of a new ATH, this phase involves a prolonged period of depreciation, marking a cooldown from the market’s peak activity.

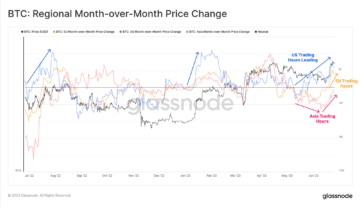
Rising Volatility Across Sectors
Both Bitcoin and Ethereum have witnessed a spike in monthly volatility, nearing statistically high levels. For momentum and directional traders, this increase in volatility serves as a critical indicator in the early stages of a bull market, signalling potential entry points for strategic trades ahead of the heightened risk of a correction.


Supply Profitability and Market De-Risking
The percentage of Supply in Profit for both Bitcoin and Ethereum has reached a statistically significant, high level, indicating a phase where a notable portion of the market is holding profitable positions. This scenario, commonly observed at the onset of previous bull markets, points to a possible de-risking.
Selling pressure from newer investors, who accumulated positions during the recovery from the bear market’s bottom, is anticipated as they seek to secure profits. The expected correction has been slightly delayed, likely due to the market’s conviction in the rally potential following ETF approvals.


For directional traders, these indicators highlight the need for vigilance with potential entry points for either long or short trades in sight. The rising stablecoin supply suggests liquidity is growing, with the potential to fuel the next market rally. However, the escalating volatility and profitability metrics hint at a market ripe for correction, emphasizing the need for prudent risk management and the readiness to capitalize on market movements.
Metric Spotlight: Active Addresses
This metric measures the momentum of network activity by comparing the monthly average of new addresses (short-term) against the yearly average (long-term), providing insights into the network’s health and adoption rate.
- Trend to Look For: A monthly average (red curve) higher than the yearly average (blue curve) suggests an expansion in on-chain activity, indicating improving network fundamentals. Conversely, a monthly average lower than the yearly average indicates a contraction, suggesting declining network utilization.
- Historical Example: In 2018, a rise above the monthly average, despite a bearish price trend, signalled growing network strength, contributing to the bull market of 2020-2021. Conversely, a drop below in early 2021, despite higher prices, indicated decreased activity and potential market challenges.
- Tools to Employ: Focus on the relative position and distance between the monthly and yearly averages to gauge the momentum. Monitor for breaks above or below key moving averages, like the 200-day MA, for additional context.
- Metric Variations: Active Addresses Momentum, Active Entities
Get Personalised Insights
We hope that Finance Bridge continues to provide valuable insights and helps you navigate the crypto landscape more effectively.
If you have an idea about how we could improve this newsletter to make it more practical for you, we invite you to engage with us. Do you have any questions about the content of this issue or any other queries? Would you like to connect directly with our team of analysts? Or are you interested in discovering how you can leverage Glassnode’s full potential?
Don’t hesitate to reach out. Your thoughts and insights will help us continue to improve the quality of our services and this newsletter, so we’re genuinely excited to hear from you. Schedule a call with a dedicated member of our Institutional sales team to begin the conversation.
Disclaimer: This report does not provide any investment advice. All data is provided for information and educational purposes only. No investment decision shall be based on the information provided here and you are solely responsible for your own investment decisions.

- SEO Powered Content & PR Distribution. Get Amplified Today.
- PlatoData.Network Vertical Generative Ai. Empower Yourself. Access Here.
- PlatoAiStream. Web3 Intelligence. Knowledge Amplified. Access Here.
- PlatoESG. Carbon, CleanTech, Energy, Environment, Solar, Waste Management. Access Here.
- PlatoHealth. Biotech and Clinical Trials Intelligence. Access Here.
- Source: https://insights.glassnode.com/finance-bridge-etf-milestones-stablecoin-surge-and-volatility-trends/
- :has
- :is
- :not
- :where
- 13
- 2000
- 2018
- 2021
- 2022
- 2024
- 5
- 74
- a
- About
- above
- acceptance
- Accumulated
- across
- actionable
- active
- activity
- Additional
- addresses
- Adoption
- advice
- against
- ahead
- aim
- Aiming
- albeit
- All
- also
- Altcoin
- Altcoins
- an
- analysis
- Analysts
- analytics
- and
- Anticipated
- any
- appears
- appetite
- approval
- approvals
- ARE
- AS
- Assets
- At
- ATH
- average
- base
- based
- BE
- Bear
- Bear Market
- bearish
- been
- begin
- behaviour
- below
- between
- Billion
- Bitcoin
- bitcoin and ethereum
- Bitcoin ETF
- Bitcoin prices
- Bitcoin Trust
- bitcoin's price
- Blue
- both
- Bottom
- breaks
- BRIDGE
- broader
- bull
- Bull Market
- by
- Calls
- CAN
- cap
- capital
- capitalize
- caution
- challenges
- characterized
- commonly
- compared
- comparing
- Connect
- content
- context
- continuation
- continue
- continues
- contraction
- contributing
- Conversation
- conversely
- Conversion
- conviction
- could
- critical
- crypto
- crypto investing
- crypto landscape
- cryptocurrency
- cryptocurrency market
- Current
- Currently
- curve
- cycle
- cycles
- Cyclical
- data
- decision
- decisions
- Declining
- decreased
- dedicated
- Delayed
- deliver
- depreciation
- Derivatives
- Despite
- developments
- digestible
- directly
- discovering
- distance
- do
- does
- Dollar
- Drop
- due
- during
- dynamics
- Early
- early stage
- edition
- educational
- effectively
- either
- emerging
- emphasizing
- enabling
- engage
- entry
- escalating
- essence
- essential
- establishment
- ETF
- ETFs
- ETH
- ethereum
- Event
- evidenced
- evident
- Examines
- exchange
- excited
- exhibited
- expanding
- expansion
- expected
- experienced
- experiencing
- exponential
- February
- felt
- Fiat
- finance
- financial
- First
- first time
- Flows
- Focus
- following
- follows
- For
- format
- from
- Fuel
- fueled
- full
- Fundamentals
- further
- future
- gateway
- gauge
- GBTC
- genuinely
- Glassnode
- Grayscale
- Grayscale Bitcoin Trust
- Grayscale Bitcoin Trust (GBTC)
- Growing
- guided
- hand
- Have
- Health
- hear
- heavy
- heightened
- heights
- help
- helps
- here
- High
- higher
- Highlight
- Highs
- hint
- historic
- historically
- holding
- hope
- How
- However
- HTTPS
- idea
- Impact
- impacting
- important
- improve
- improving
- in
- Increase
- increased
- increasing
- indicated
- indicates
- indicating
- Indicator
- Indicators
- inflows
- information
- informed
- initial
- insights
- Institutional
- Institutional Interest
- interest
- interested
- interval
- into
- introduce
- investing
- investment
- investor
- Investors
- invite
- involves
- issue
- IT
- Key
- landmark
- landscape
- large
- Led
- Level
- levels
- Leverage
- like
- likely
- Liquidity
- Long
- long-term
- Look
- lower
- Lows
- Macro
- Mainstream
- make
- Making
- management
- Market
- market sentiment
- market share
- Markets
- marking
- May..
- measures
- member
- metric
- Metrics
- Milestones
- moment
- Momentum
- money
- Monitor
- monthly
- more
- movements
- moving
- moving averages
- multi-year
- NARRATIVE
- Navigate
- navigating
- Navigation
- Near
- nearing
- Need
- network
- New
- newer
- Newsletter
- next
- no
- notable
- observed
- october
- of
- offer
- on
- On-Chain
- on-chain activity
- only
- opportunities
- Optimism
- or
- Other
- our
- out
- outperforming
- overview
- own
- Pace
- participant
- particularly
- Peak
- percentage
- period
- Personalised
- perspective
- phase
- phenomenon
- plato
- Plato Data Intelligence
- PlatoData
- points
- portion
- position
- positioning
- positions
- possibility
- possible
- potential
- Practical
- predominantly
- presence
- presents
- pressure
- previous
- price
- Prices
- Profit
- profitability
- profitable
- profits
- provide
- provided
- providing
- purposes
- quality
- queries
- Questions
- rally
- Rate
- RE
- reach
- reached
- reaching
- Readiness
- realized
- rebalancing
- recovery
- Red
- regulatory
- relative
- renewed
- report
- resilience
- responsible
- Rise
- rising
- Risk
- risk management
- robust
- s
- sales
- same
- scenario
- secure
- Seek
- seems
- seen
- sentiment
- serves
- Services
- serving
- setting
- Share
- shift
- Shifts
- Short
- short-term
- showcasing
- showing
- Sight
- significant
- since
- slightly
- So
- solely
- span
- spike
- Spot
- Spotlight
- stablecoin
- Stablecoins
- Stage
- stages
- Starting
- statistically
- Strategic
- streamlined
- strength
- strong
- substantial
- successful
- such
- suggest
- Suggests
- supply
- surge
- surpasses
- SWIFT
- T
- team
- terms
- Tether
- Tether (USDT)
- than
- that
- The
- the information
- their
- These
- they
- this
- Through
- time
- to
- Tokens
- Total
- Traders
- trades
- Trading
- transfer
- Trend
- Trends
- triggered
- Trust
- Turned
- typical
- underscore
- unique
- us
- USDT
- ushered
- utilization
- Valuable
- value
- vigilance
- Volatility
- volumes
- was
- Wave
- we
- which
- while
- WHO
- will
- with
- within
- witnessed
- would
- yearly
- you
- Your
- zephyrnet