Your gateway to successful crypto investing guided by data and research
Executive Summary
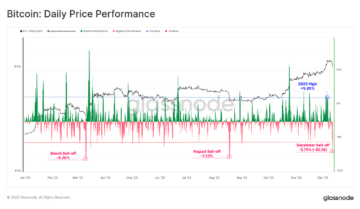
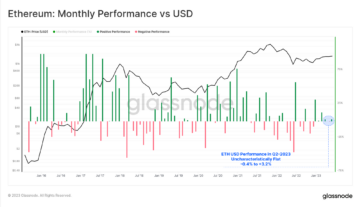
- Monthly Overview: In April, despite high trading volumes and substantial ETF inflows at the beginning of the month, Bitcoin faced consolidation pressures with prices ranging from $60k to $66.7k, primarily due to short-term holder sell-offs. Meanwhile, Ethereum’s ecosystem saw heated debates over staking policy changes, highlighting concerns about its future as a scalable platform and monetary asset.
- Market Momentum: Currently, Glassnode’s composite momentum index is indicating a market cool-down. Several key metrics have entered downtrend phases, suggesting reduced demand and slowing positive momentum.
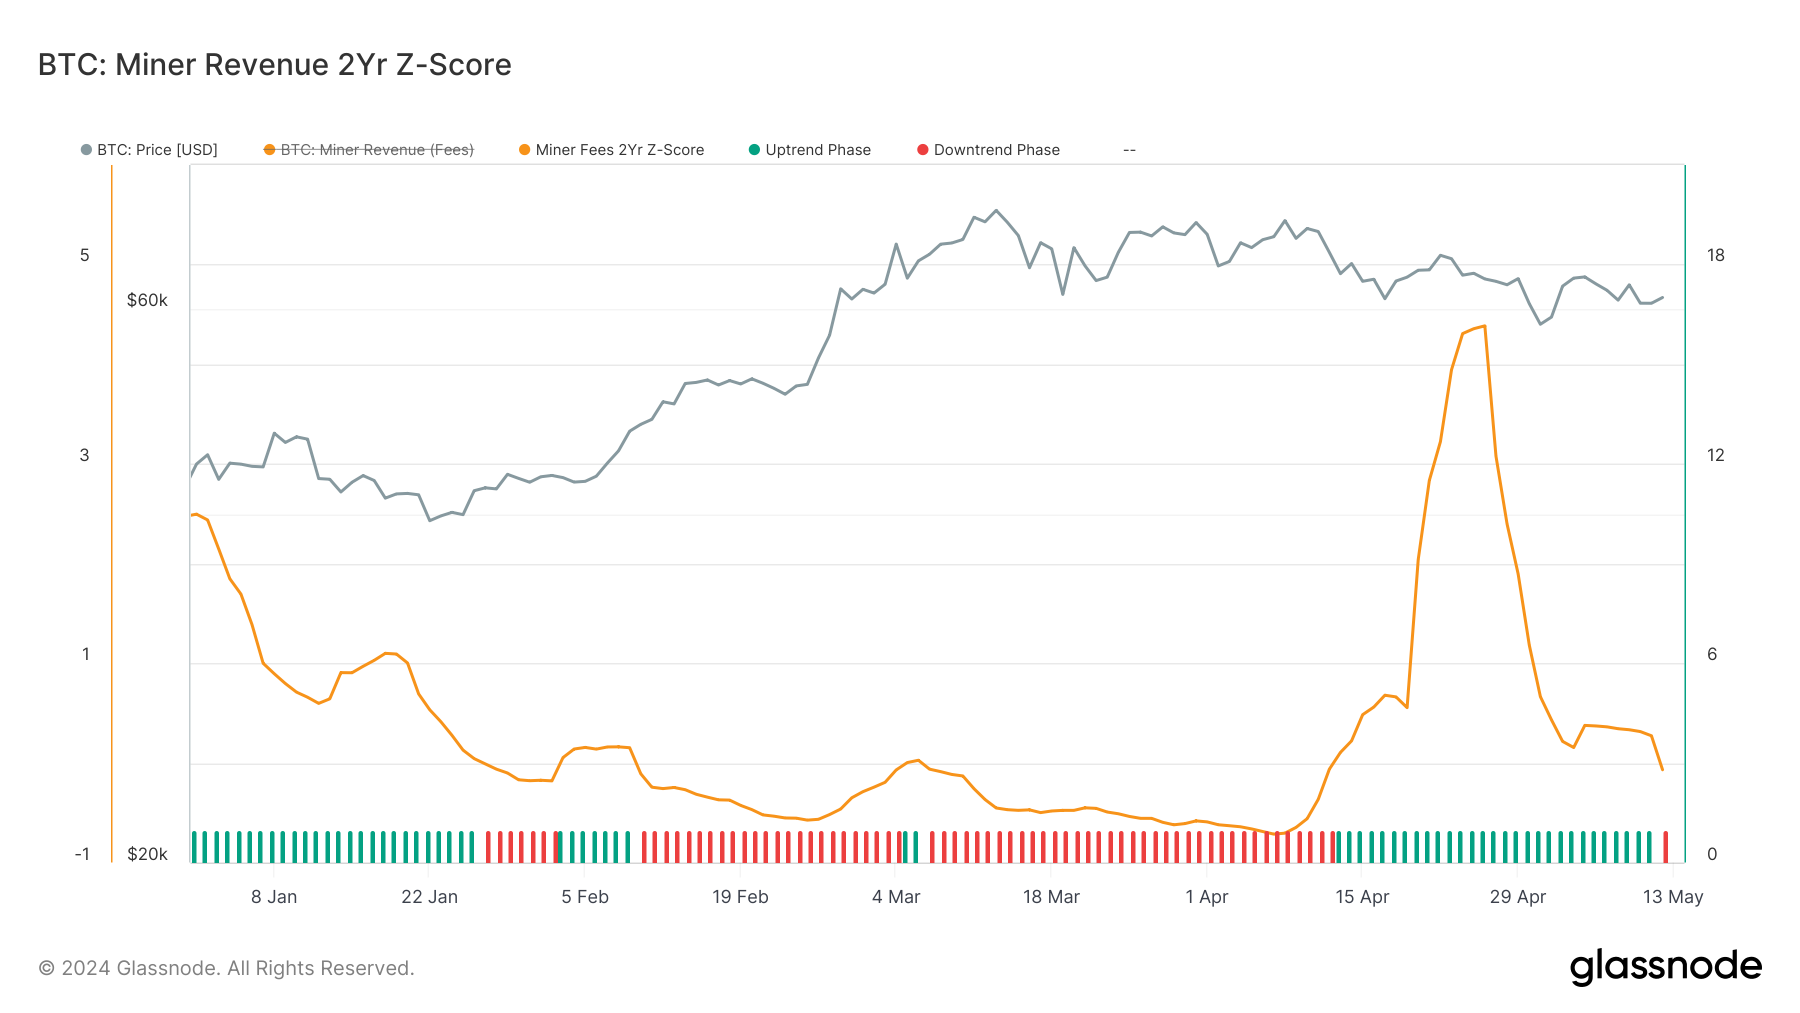
- Metric Spotlight: Miner Revenue Momentum uses the proportion of miner revenue from fees to assess blockspace demand, with a 2-Year rolling Z-Score highlighting key inflection points. High Z-scores indicate increased network activity and congestion, while declining Z-scores suggest reduced demand and potential market cooling.
In April 2024, investor behaviour in the digital asset market seems to have been shaped by two major emotions – the anticipation for the fourth Bitcoin halving and the disappointment from the lacklustre price action that followed it. Although the halvings have historically proven to be bullish events in the long term, in the short-term they tend to trigger a sell-the-news reaction from the market.
For example, similar events in 2016 and 2020 also saw immediate market corrections, despite the long-term bullish implications of reduced Bitcoin supply. This year, the effect was compounded by macroeconomic uncertainties and geopolitical tensions, leading to a -16.09% decline in Bitcoin’s price in the few weeks post-halving.
Similarly, Ethereum experienced notable fluctuations with its price dropping by -17.80%, partly due to ongoing uncertainty around U.S. spot ETH ETF approvals and internal community debates over proposed staking policy changes.
This reaction is reflective of a broader market sensitivity to major anticipated events, where traders often take profits leading to short-term sell-offs. In our extensive coverage of the halving and its anticipated effects, we correctly anticipated that such a sell-off might happen.
If you would like to learn more about the dynamics that are likely to keep shaping Bitcoin and the broader cryptocurrency markets in the weeks and months to come, we encourage you to revisit our research articles:
In this edition of Finance Bridge, we will examine the continued impact of U.S. Spot ETFs which supported April’s trading volumes significantly even amid broader market pullbacks. We will also provide an update on the factors that may influence Ethereum’s monetary characteristics and its technological adaptability in the DeFi sector.
Monthly Market Overview
The first weeks of April saw a continuation of Bitcoin’s robust performance, supported by an upsurge in spot trading and on-chain exchange volumes. Bitcoin’s price consolidated between $64k and $73k, following a peak in spot trading volumes that reached approximately $14.1 billion in mid-March. This level of activity was largely driven by the US Spot ETFs, which have become a significant force in the market, introducing substantial new demand that has helped sustain price levels above historical highs. Read more
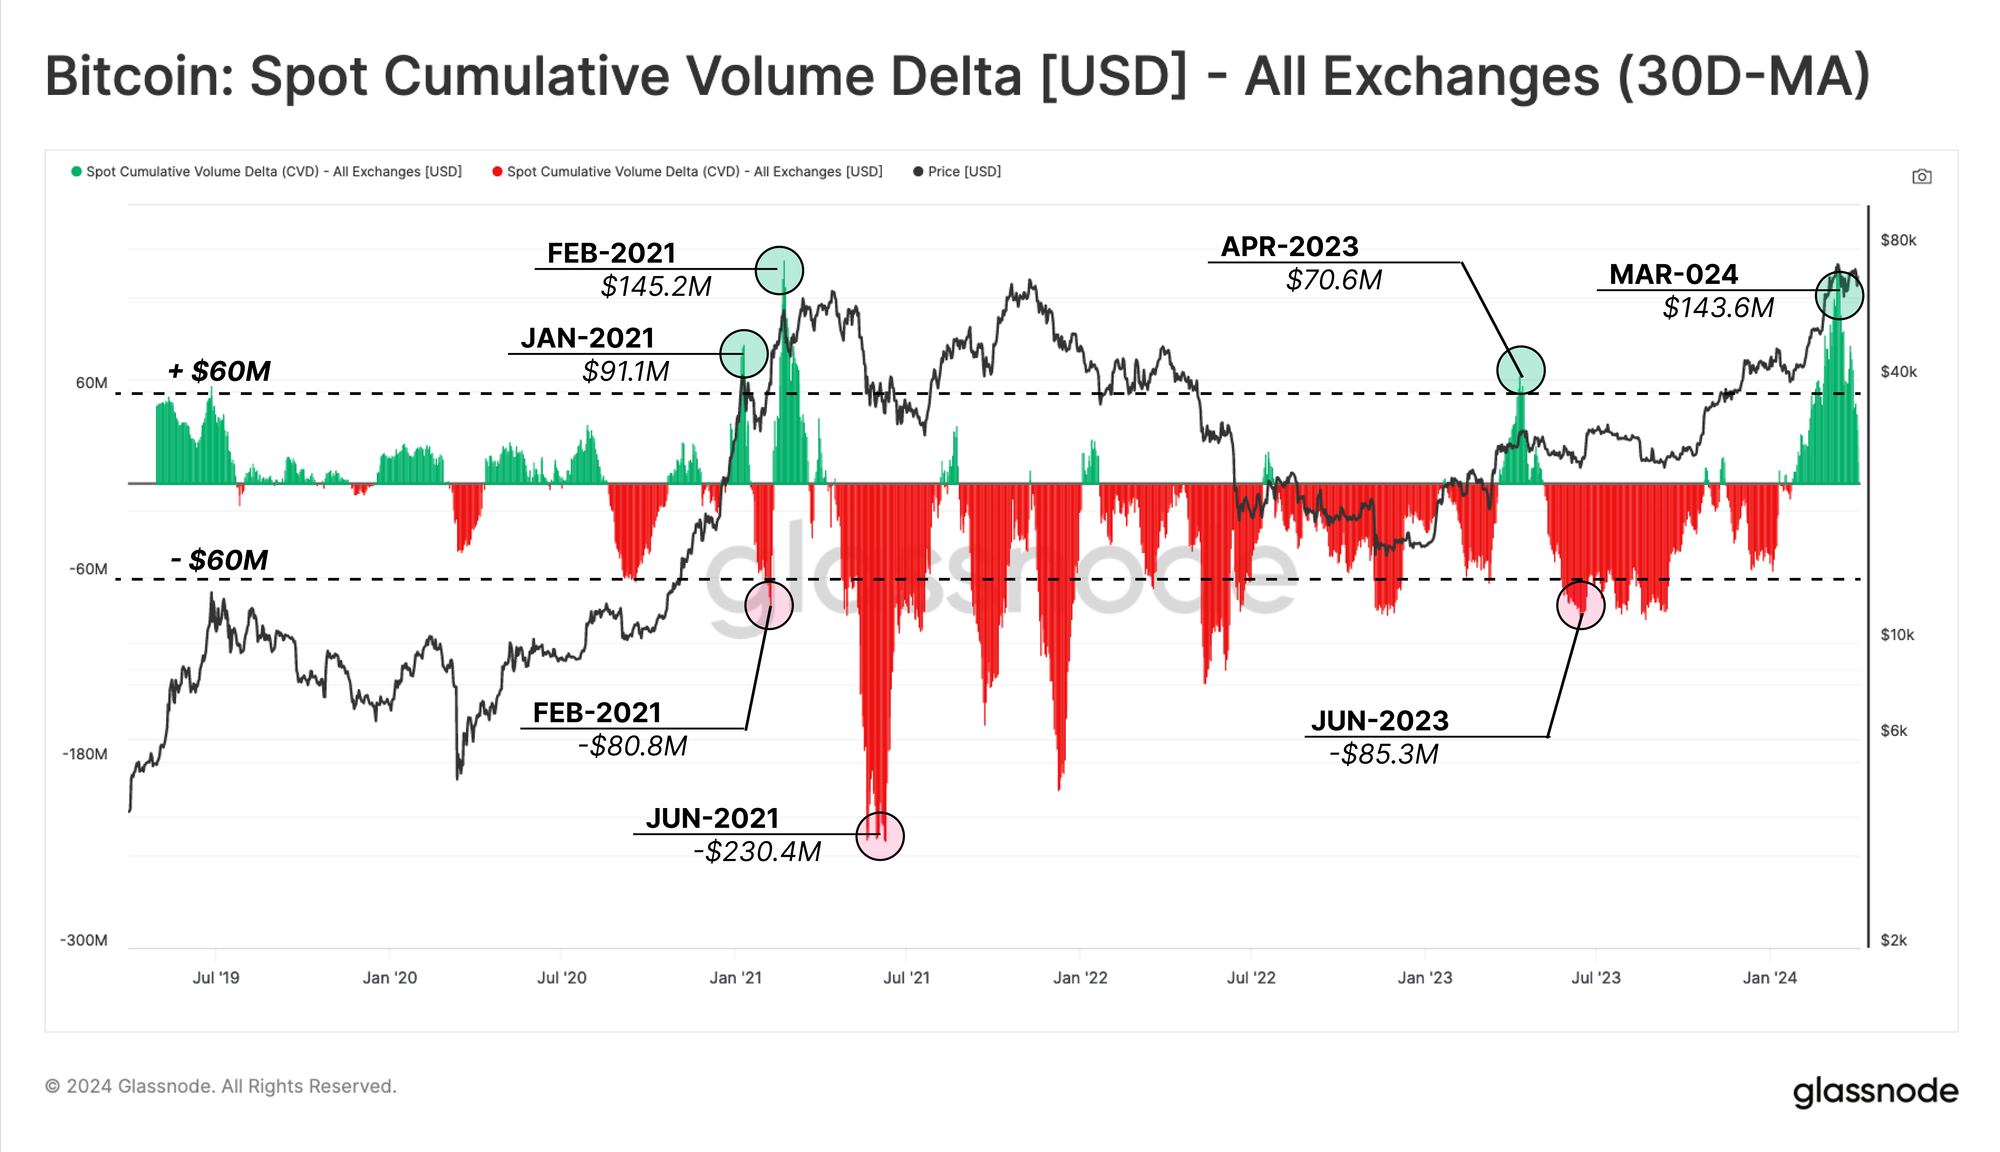
The daily spot trade volumes, although reduced from the mid-March peak to about $7 billion per day, still mirrored the intensity of the 2020-2021 bull market. The strong trading volume underscored a persistent euphoria sentiment in the market, characterized by a net buy-side bias in the Cumulative Volume Delta (CVD). This indicator, which measures the net amount of buying versus selling, highlights the ongoing speculative interest and the bullish sentiment prevailing among traders.
Moreover, the exchange flows, both inflows and outflows, were remarkably high, averaging $8.19 billion per day, significantly exceeding the peak levels observed during the previous bull market. Binance, while still holding a substantial portion of the market share in spot trading at 37.5%, has seen its dominance decrease from higher levels in previous years, indicating a broadening of market activity across various platforms. Read more
The Effects of the Halving
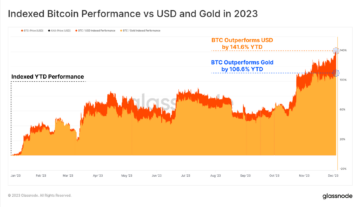
In mid-April, Bitcoin experienced its fourth halving event, reducing daily supply inflation by 50%, dropping the issuance rate to 0.85% per annum. This reduction reinforced Bitcoin’s hard money status and it marked the first time Bitcoin surpassed gold in terms of issuance scarcity. Read more
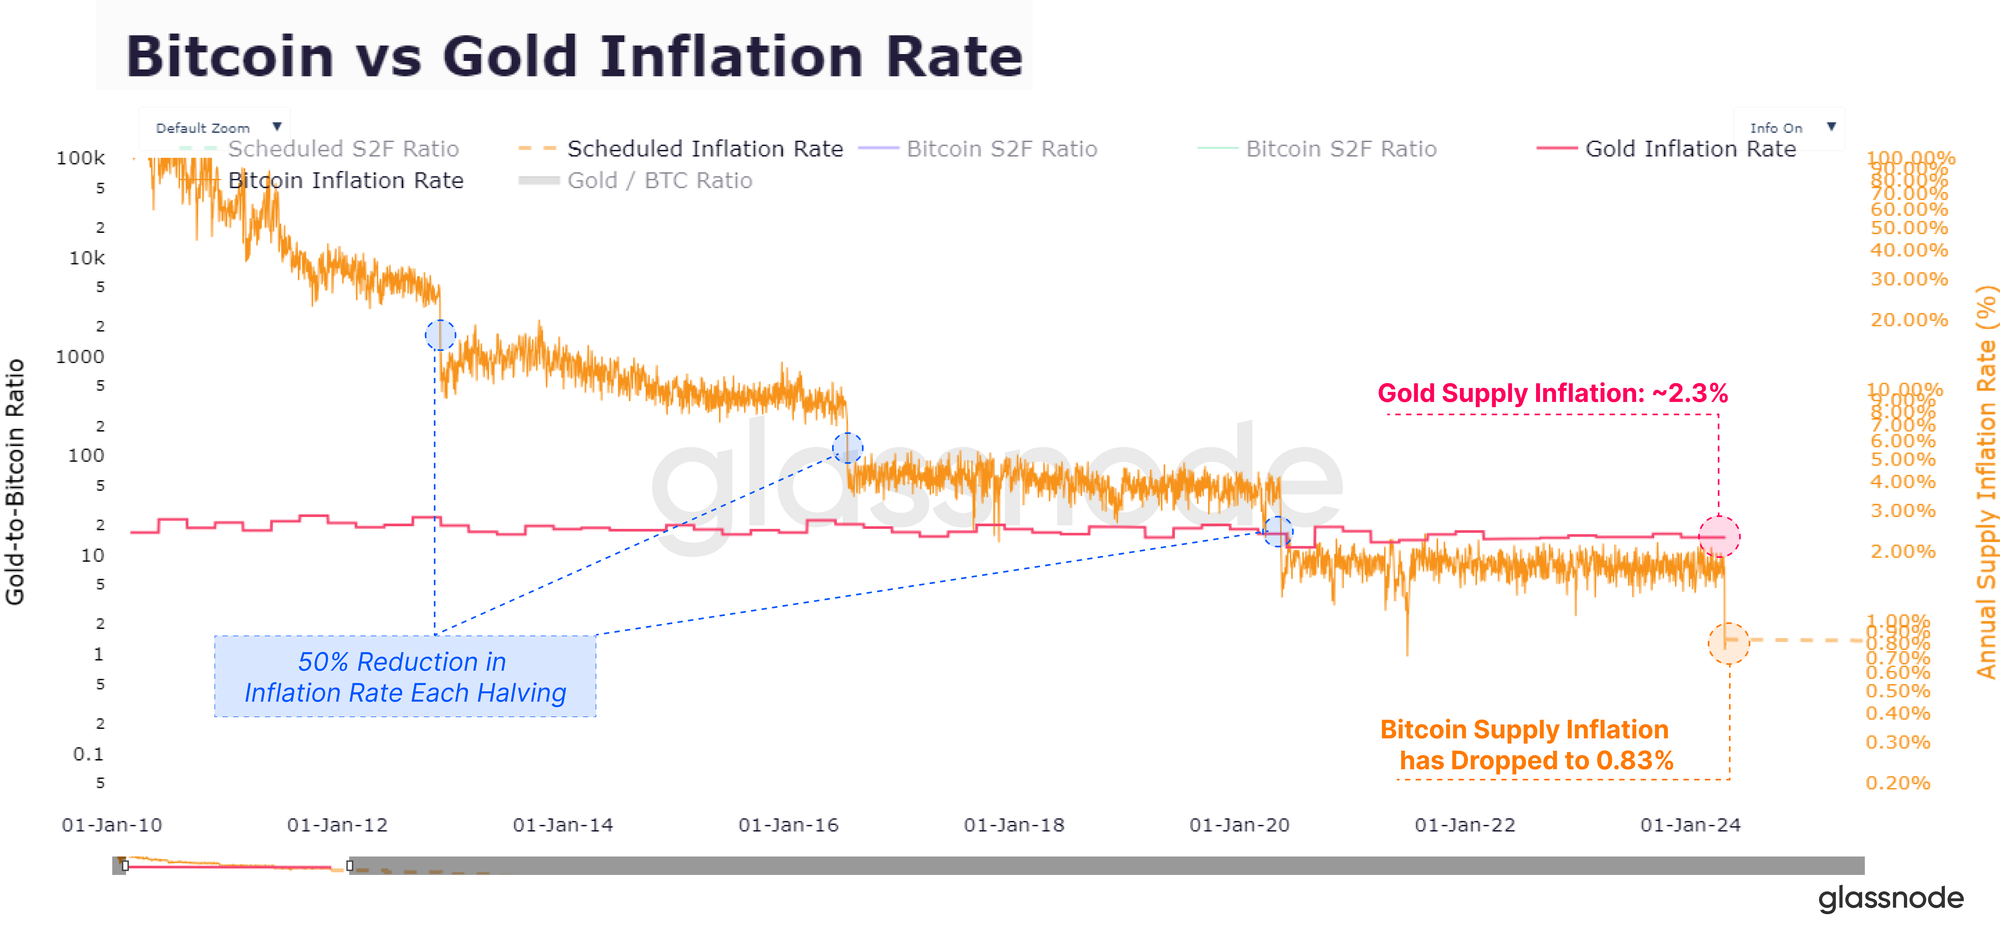
At the same time, this decrease in issuance did not significantly impact market dynamics due to the small fraction of newly mined coins compared to global trading volumes. Spot and derivatives trading volumes continued to dominate the market, with new supply accounting for less than 0.1% of aggregate capital movements.
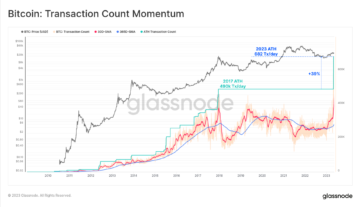
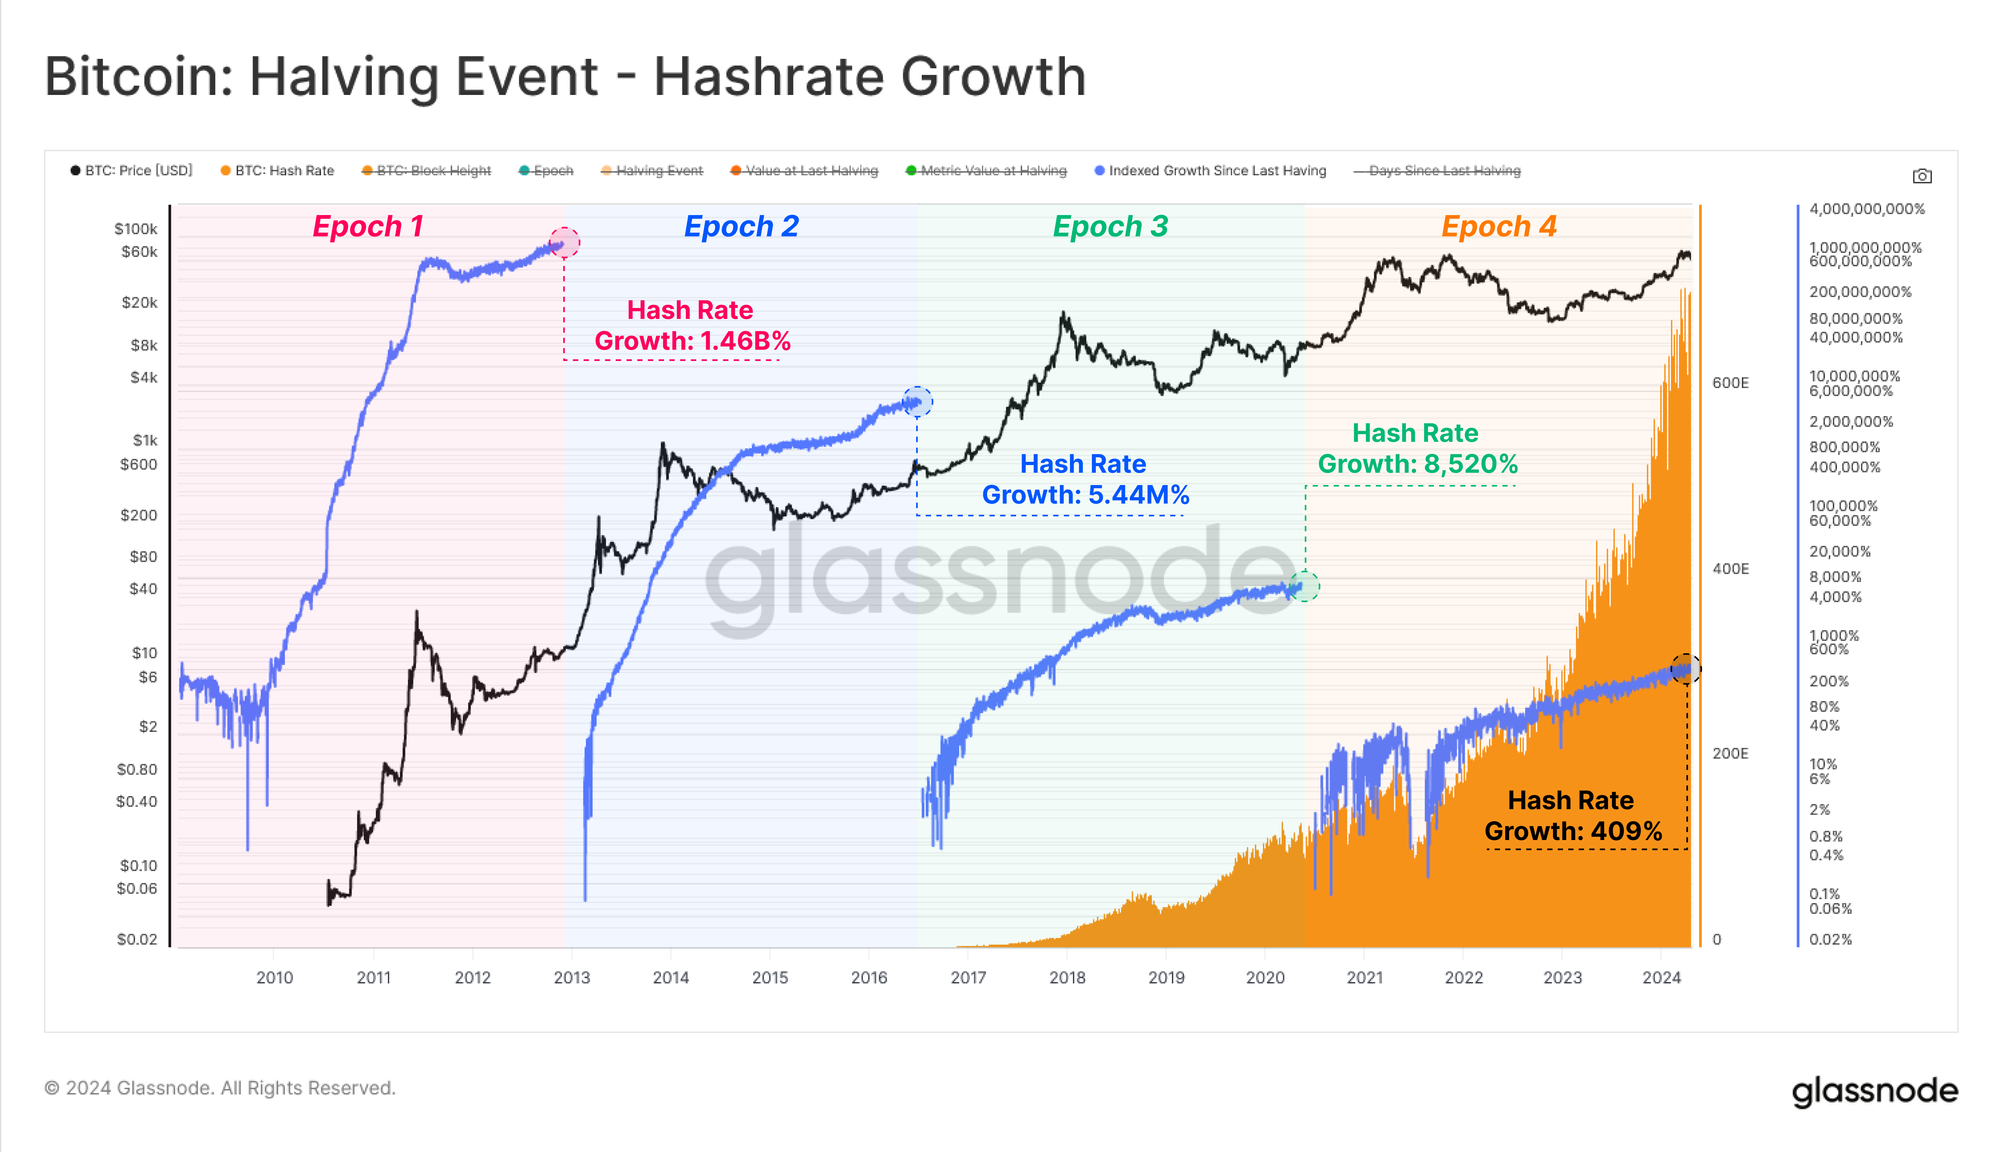
On the other hand, Bitcoin reached new milestones across several important metrics. The network’s fundamentals showed notable trends across various measures. Network hashrate reached new all-time highs as miners invested in efficient hardware and optimized operational costs, ensuring that reduced issuance did not compromise the security budget. This investment indicates that the reduced subsidy is not an impediment for miners. Read more
Despite diminishing growth rates in network statistics due to the expanding ecosystem, the absolute value of these measures reached new highs. In particular, a staggering $106 trillion in value was transferred and settled via the Bitcoin network over the past four years. This impressive figure underscores Bitcoin’s capability to maintain its position as a premier settlement network, regardless of volatility and cyclical drawdowns.
Navigating Market Corrections
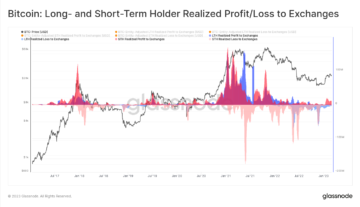
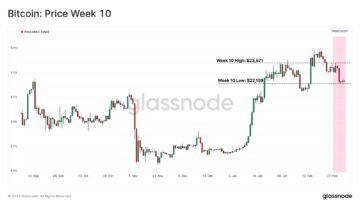
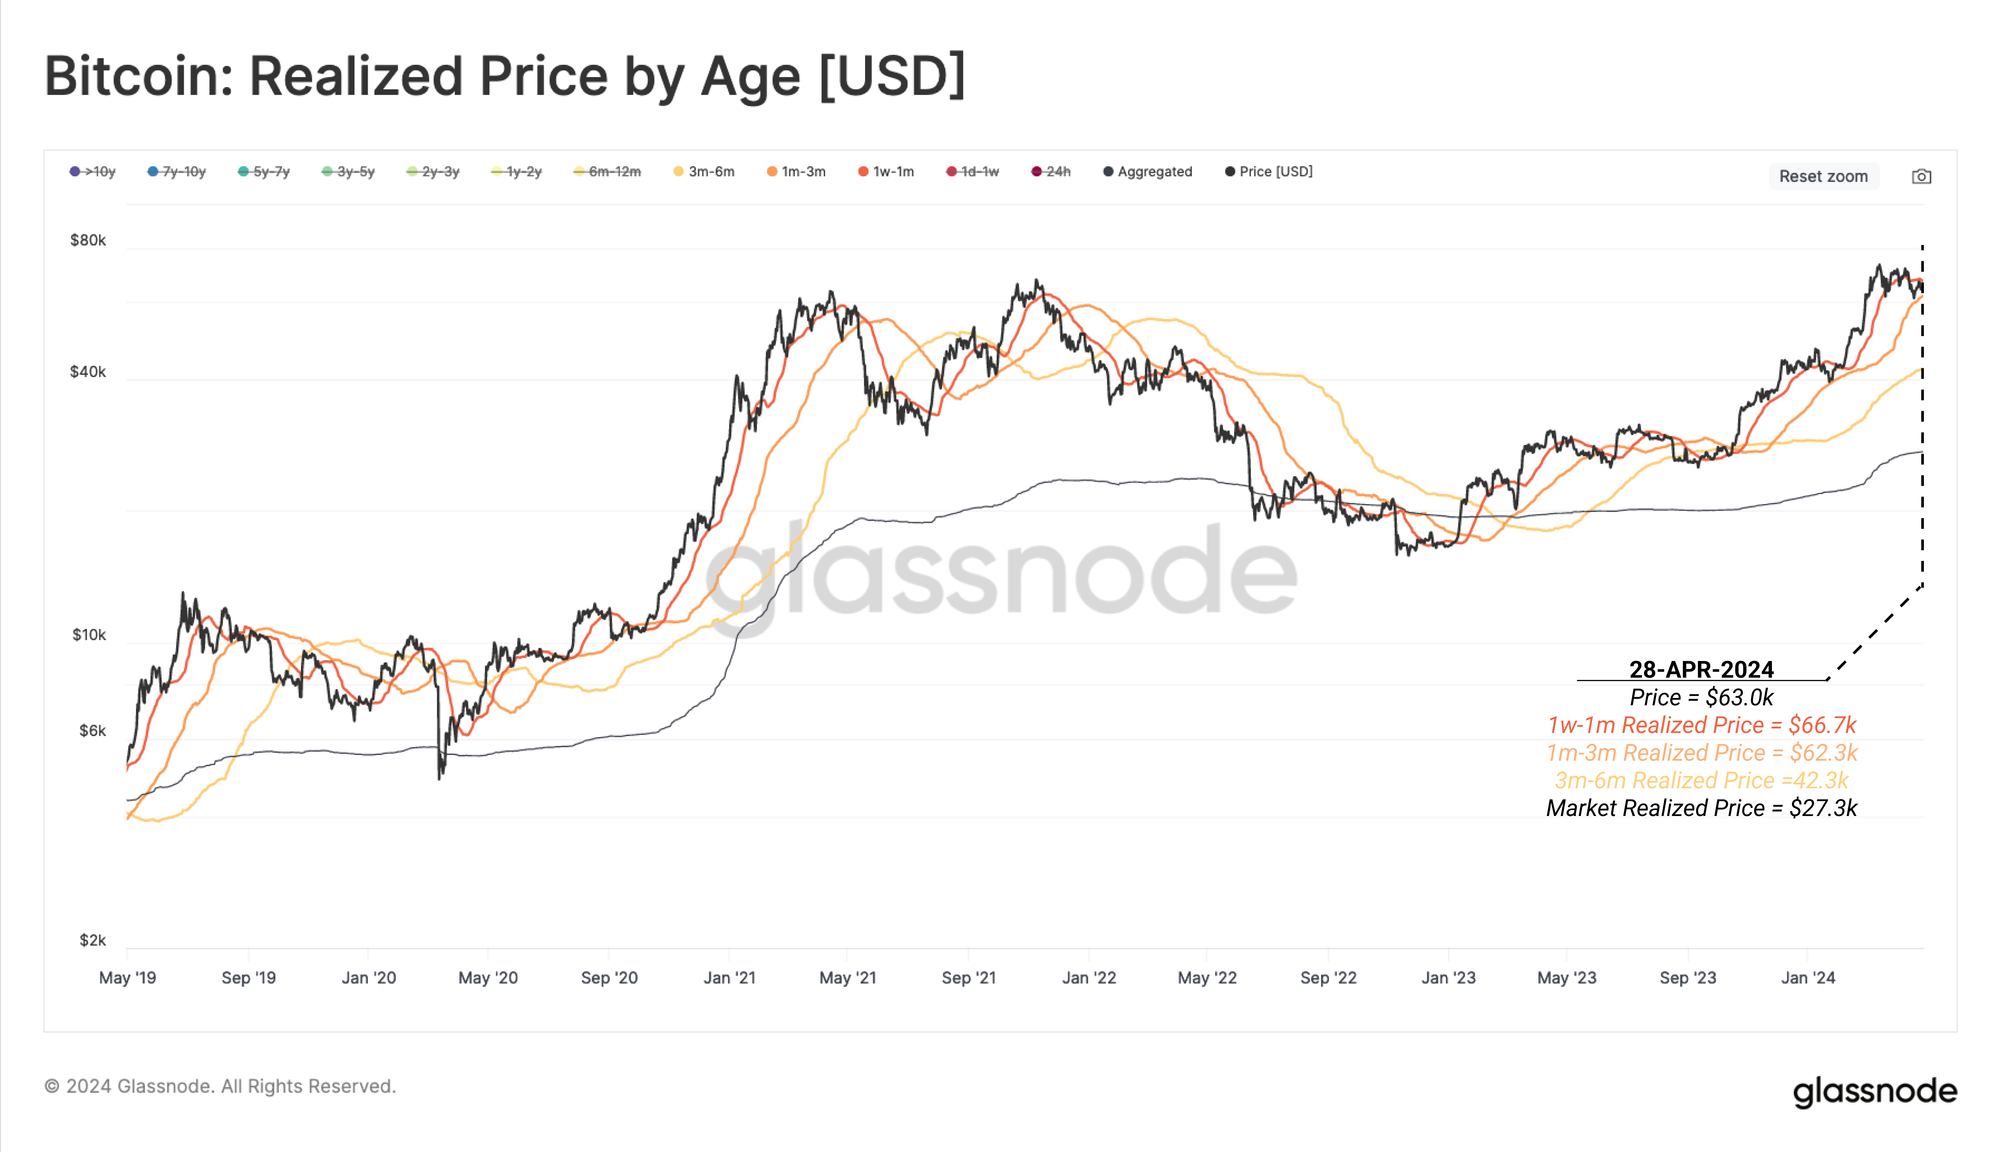
In the last week of April, the Bitcoin market settled into a phase of consolidation following the halving event. Prices ranged between $60k and $66.7k after the March peak of $73k. During this period, sell-side pressure intensified as short-term holders (STHs), particularly those who bought BTC within the past 1-6 months, dominated realized losses.
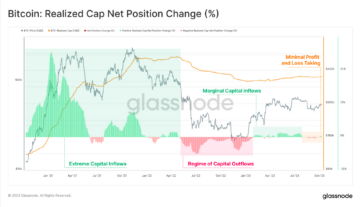
Despite this heightened selling pressure, the Net Unrealized Profit & Loss (NUPL) metric indicated that the market remained within the “Euphoria” phase of the bull market. However, the metric also showed a meaningful cooling off since the correction began. The selling pressure from STHs, who were realizing significant losses, became a key indicator of local market lows.
Using the Glassnode Breakdown metric suite, we can observe that the cost basis of STHs who acquired BTC in the past 1 week to 1 month acts as a critical marker of market sentiment. Their realized losses tend to peak near local market bottoms, suggesting that seller exhaustion within this group often signals an upcoming reversal. Read more
Glassnode’s Breakdown Metrics are a suite of 28 new metrics dedicated to institutional clients with the most rigorous analytical needs. Users can significantly enhance their understanding of capital flows, asset fundamentals, and market sentiment by examining detailed breakdowns based on the age of holdings and wallet size distributions.
Institutional customers can access these new metrics by logging into Glassnode Studio, navigating to Charts, and selecting Breakdowns from the metrics catalogue. For a detailed overview of the new metrics and how to apply them in analysis, read this article.
Ethereum’s Development and Controversies
In April, the Ethereum ecosystem found itself at the centre of a heated debate surrounding changes to the network’s staking policy. New innovations such as Liquid Staking, Restaking, and Liquid Restaking protocols have significantly boosted the demand for staking on Ethereum, leading to unprecedented growth in staking participation. Over 31.4 million ETH, or approximately 26% of the total supply, is now staked, driven primarily by Restaking protocols like EigenLayer and Liquid Restaking providers. These developments have introduced additional yield opportunities, creating incentives that go beyond the original Proof-of-Stake vision.
Proposals to cap annual issuance to slow the staking pool’s expansion have been met with significant resistance from the community. Proponents argue that such measures are necessary to safeguard Ethereum’s monetary role and prevent derivative tokens from gaining outsized influence over the network. Opponents, however, see these restrictions as impediments to innovation and argue that no changes are needed. The conversation continues to evolve as stakeholders strive to balance Ethereum’s monetary policy with the growing demands of decentralized finance.
Meanwhile, concerns persist that this rapid growth in staking could dilute Ethereum’s function as a monetary asset and shift governance power toward derivative projects that issue staking tokens. The future of Ethereum’s staking landscape remains uncertain, as the community navigates this delicate balancing act to protect both network scalability and its function as a store of value. You can find the detailed analysis in the full report here.
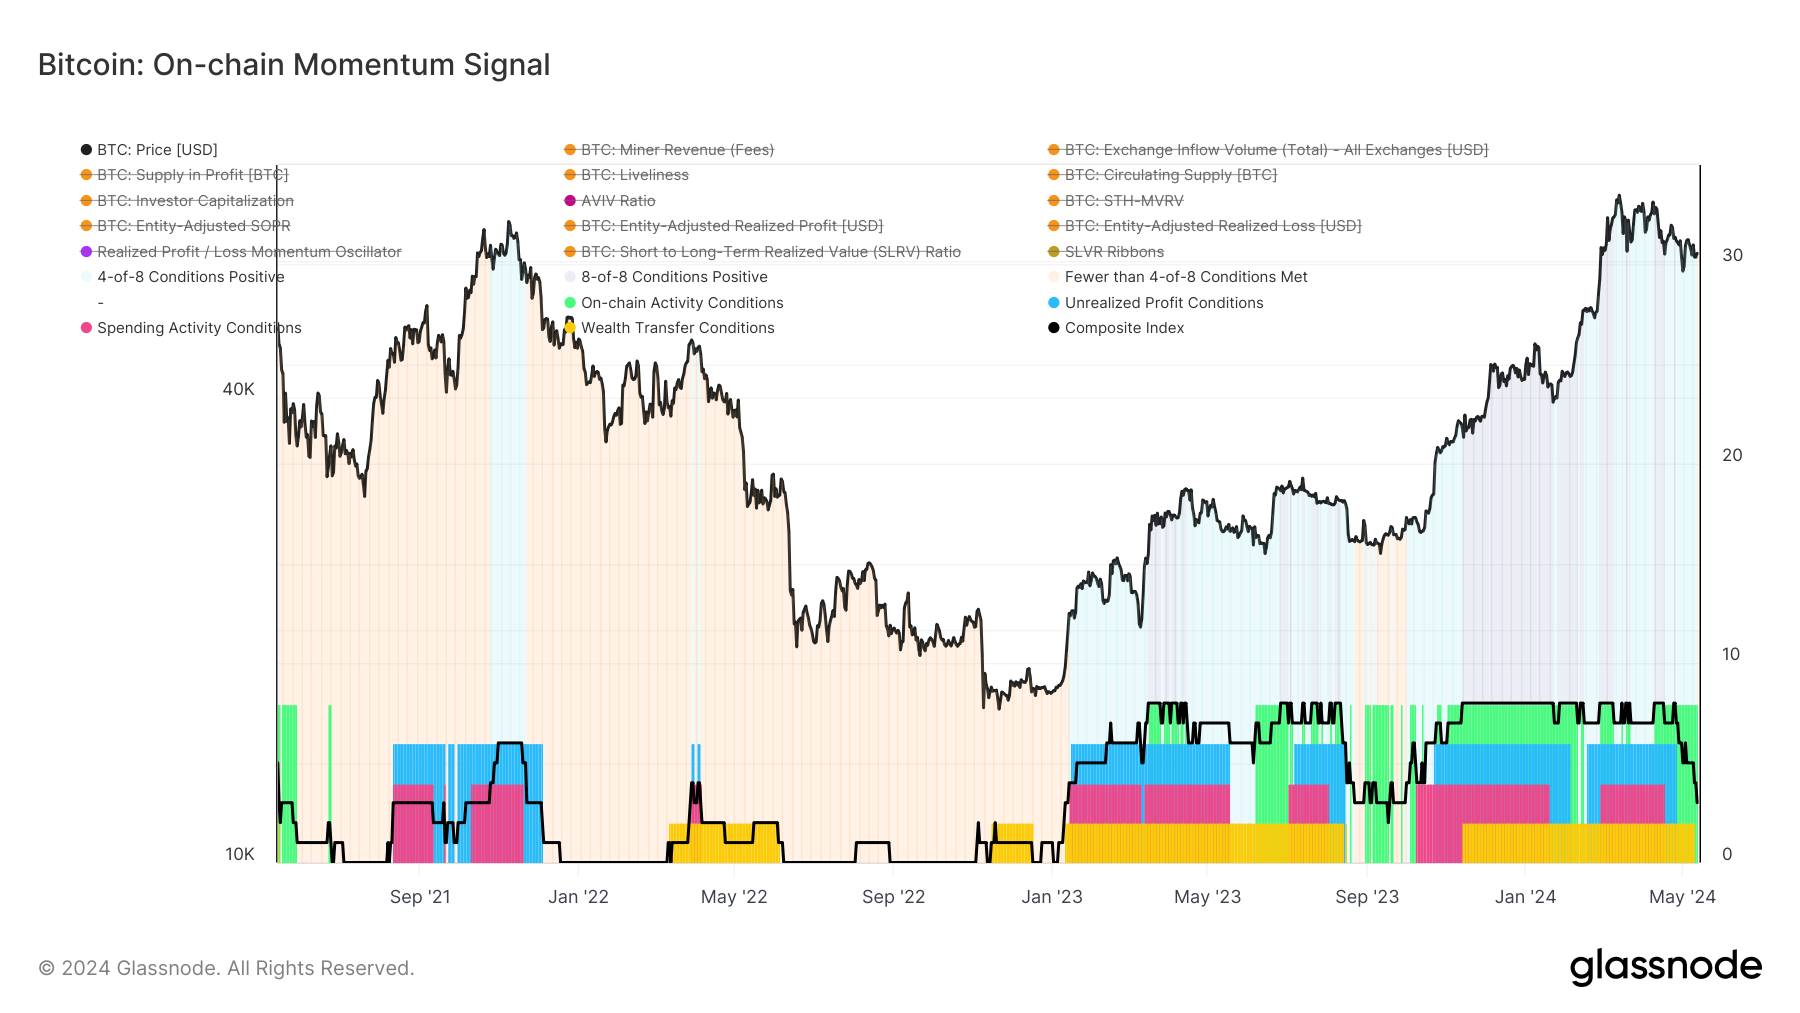
Tracking market momentum during a bull run requires a detailed analysis of key on-chain data to capture the underlying trends and shifts in market behaviour. Glassnode’s exploratory framework offers a potential approach to this dilemma by focusing on four primary categories:
- On-Chain Activity: This metric uses network activity and adoption rates to identify periods of growth and expansion in the user base. Increased network activity typically correlates with rising market momentum.
- Market Profitability: By assessing the unrealized profit held by investors, this metric identifies periods where market participants are experiencing gains, which can indicate a healthy and upward-trending market.
- Spending Behavior: This category spots periods when there is sufficient demand to absorb profit-taking by existing holders. High demand in these periods suggests sustained positive momentum.
- Wealth Distribution: By examining the transfer of wealth between long-term holders and new market participants, this metric provides insights into market cycles and potential inflexion points.
By integrating these metrics into a composite index, analysts can assess the strength and direction of market momentum more holistically. This approach allows traders to make informed decisions based on a nuanced understanding of the market’s current state and potential future movements.
Currently, fewer than 4 out of the 8 conditions for a robust momentum are met, indicating a cool-down period in the market.
In the aftermath of Bitcoin’s halving event in April 2024, several key metrics have shown significant changes against previous trends, reflecting a potential for a short-term shift in market dynamics:
- Miner Revenue 2Yr Z-Score: Following the halving, there was a notable spike in miner revenue as competition for block space intensified, particularly for transactions involving Runes. Although this surge subsided slightly, revenue levels remained above historical norms. Recently, however, the Miner Revenue 2-year Z-Score has entered a downtrend phase for the first time in a month, indicating a reduction in demand for block space.
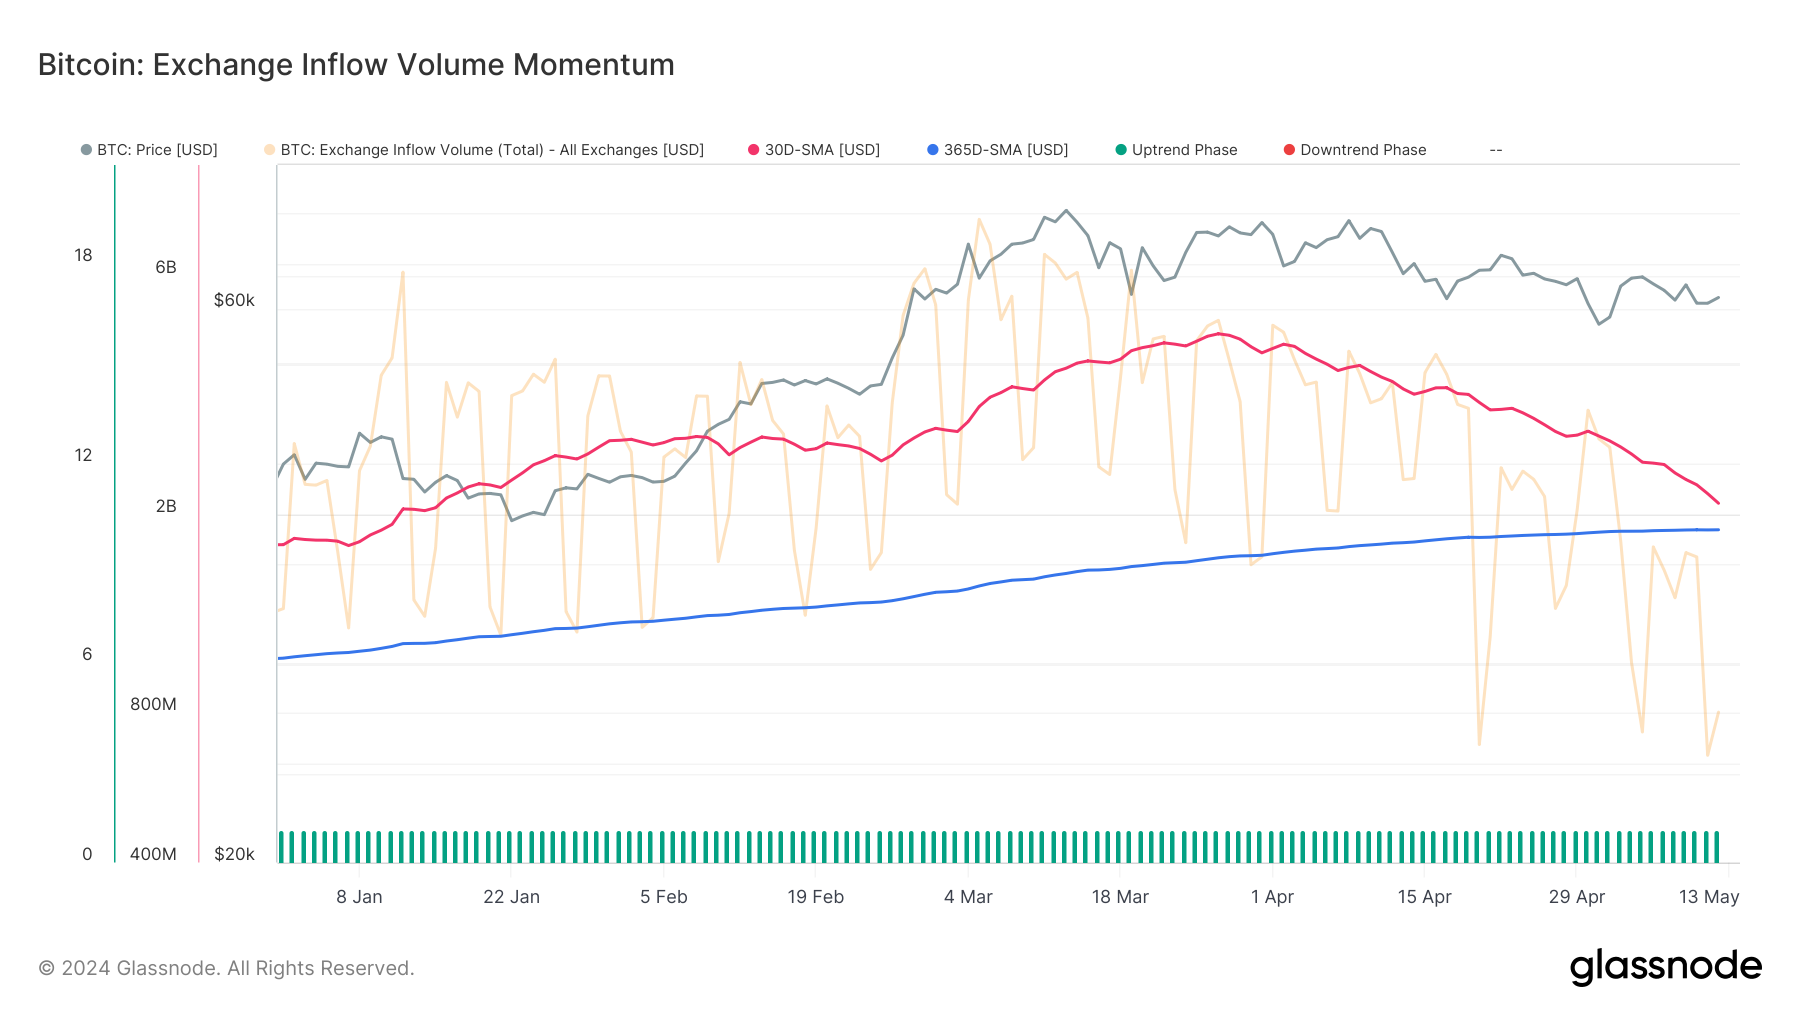
- Exchange Inflow Volume: Initially maintaining higher levels than the yearly average, the Exchange Inflow Volume peaked in late March and has since entered a consistent downtrend. This shift suggests that the positive momentum in market inflows is slowing and might soon reverse, signalling a cooling off of buying pressure.
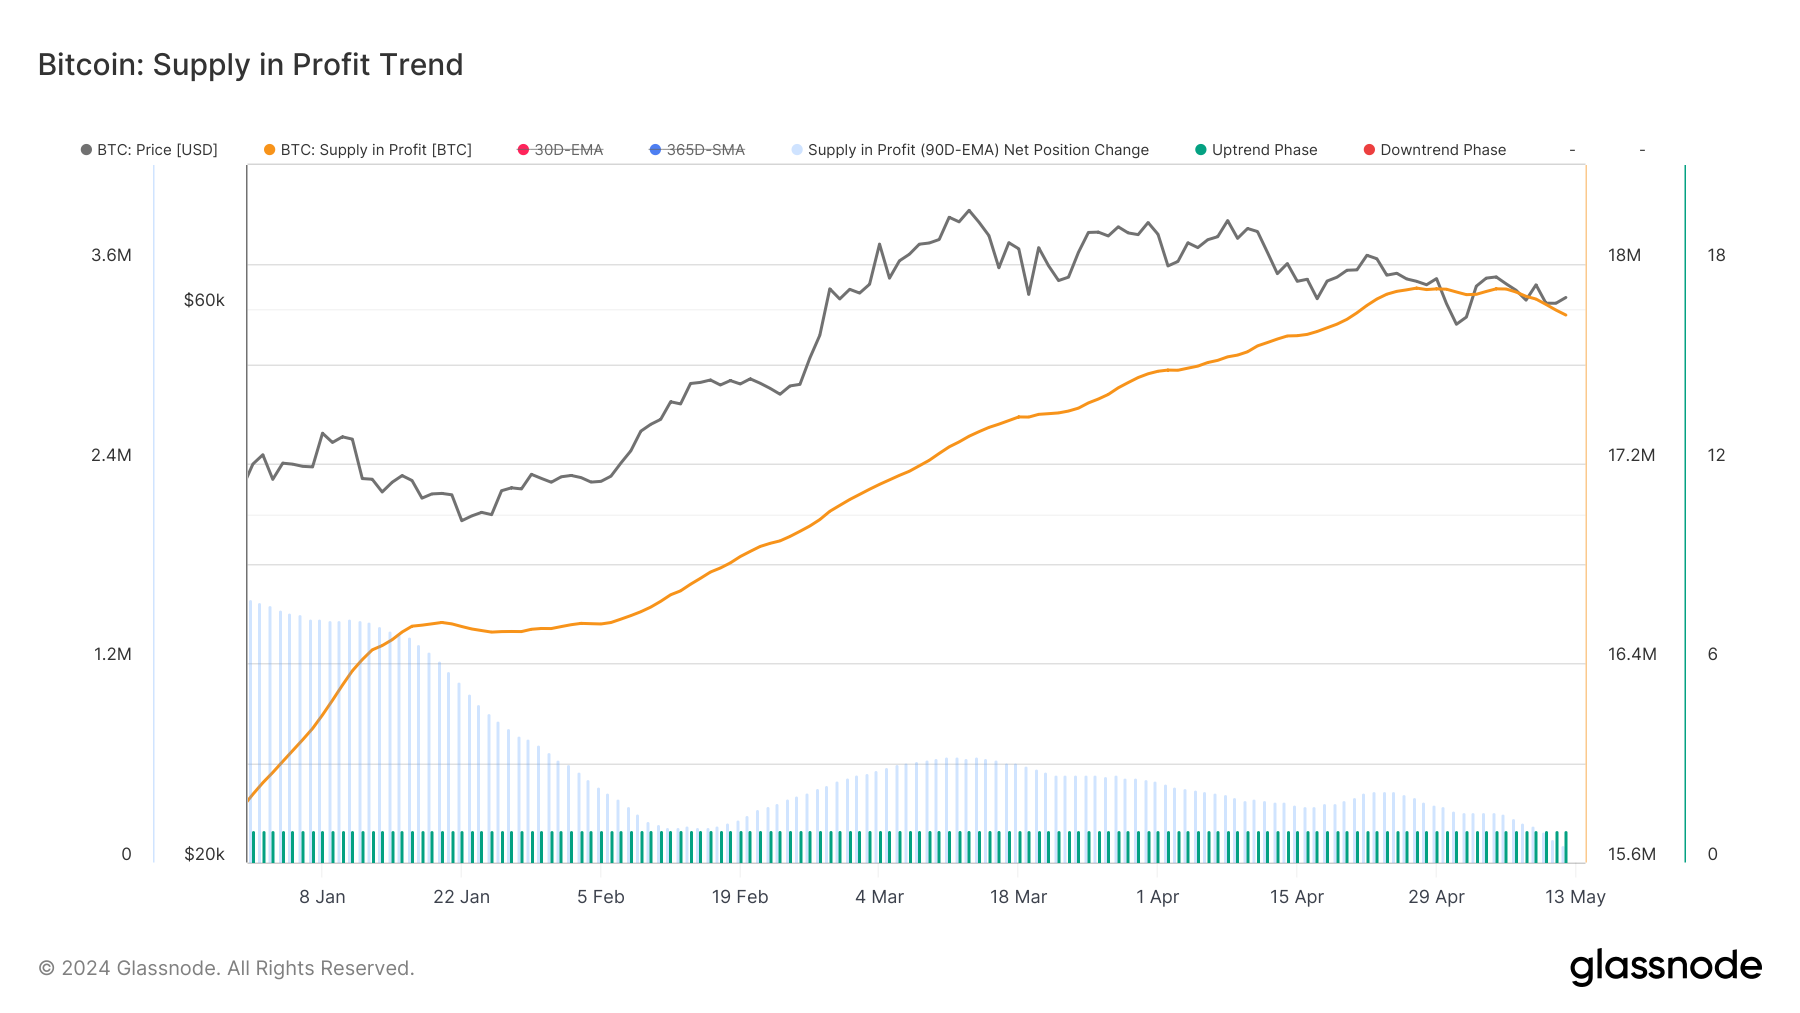
- Supply in Profit Trend: While still showing a positive trend, the Supply in Profit has begun to show signs of reversal, both in absolute terms and as an EMA over 90 days. This metric, although still in an uptrend phase, indicates that fewer holders are in a profit position, which could affect market sentiment.
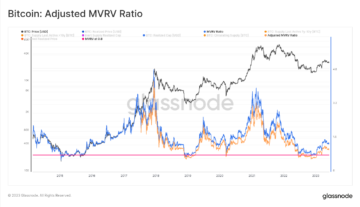
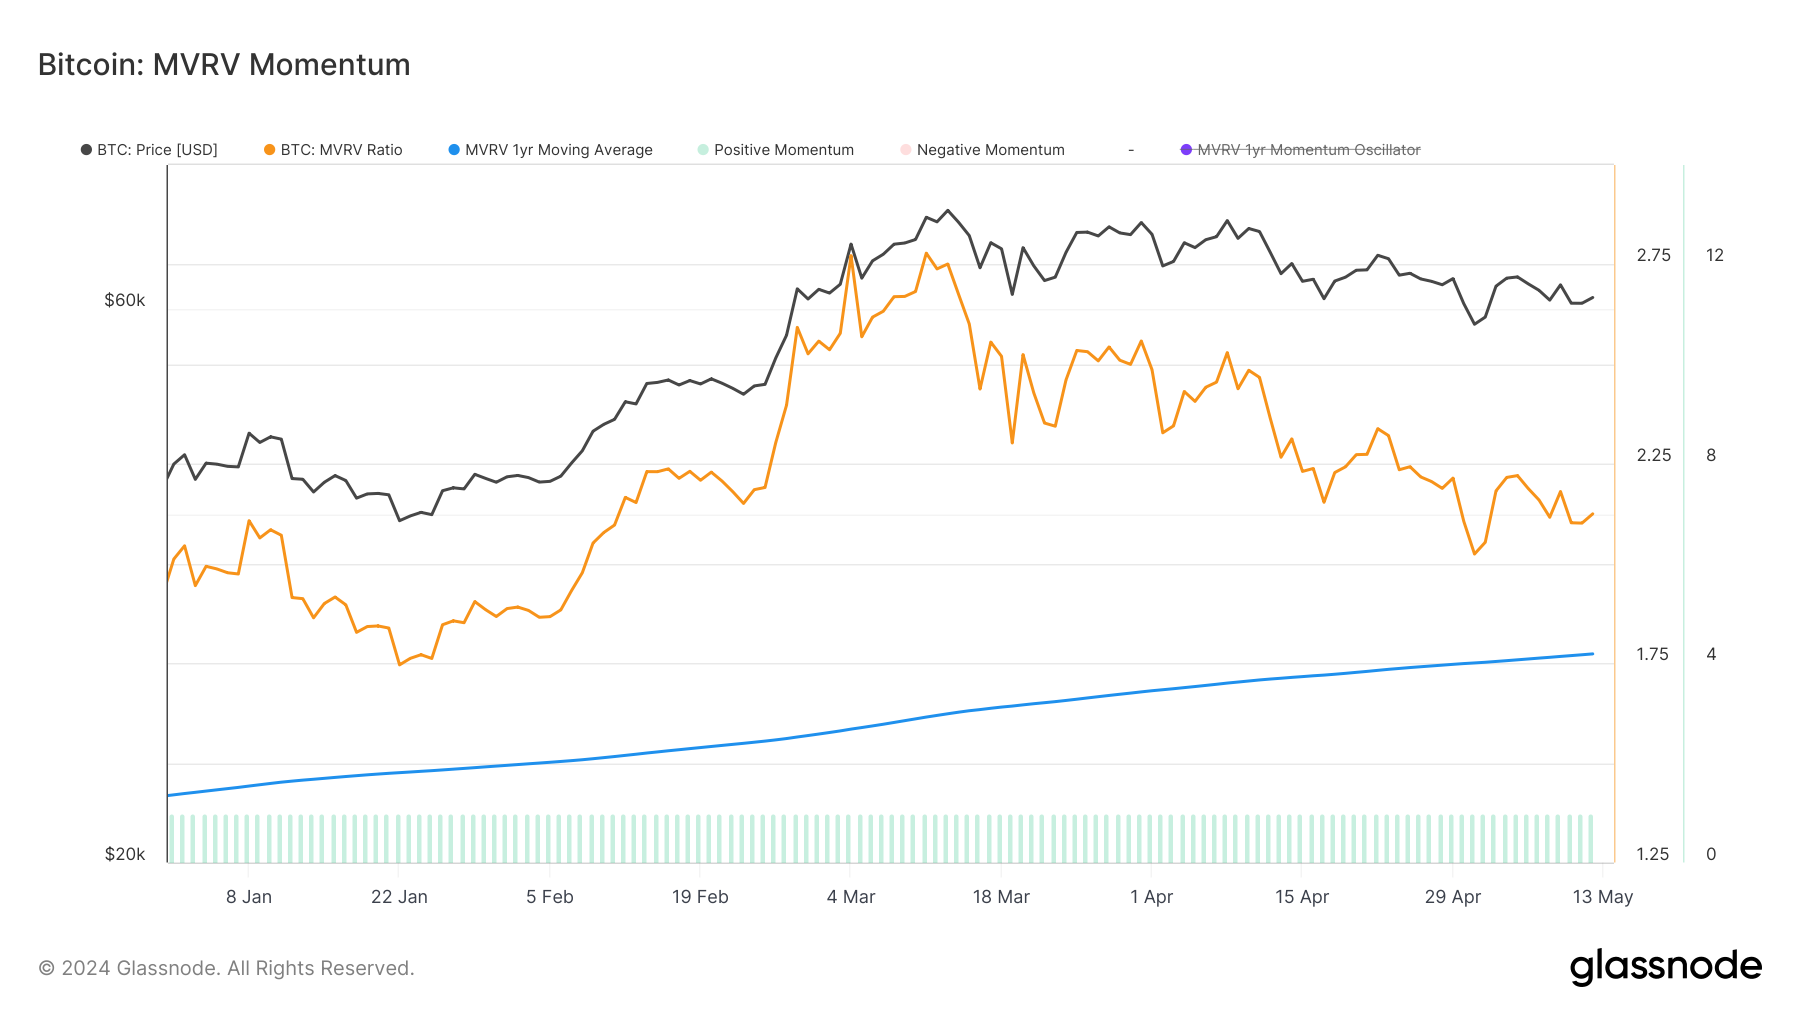
- MVRV Momentum: The overall Market Value to Realized Value (MVRV) Momentum remains above the yearly average, indicating that, on average, holdings are still valued higher than their cost basis. However, the Short-Term Holder MVRV has reversed and is now trending downward, suggesting that recent market entrants are starting to see less profit, which may increase selling pressure.

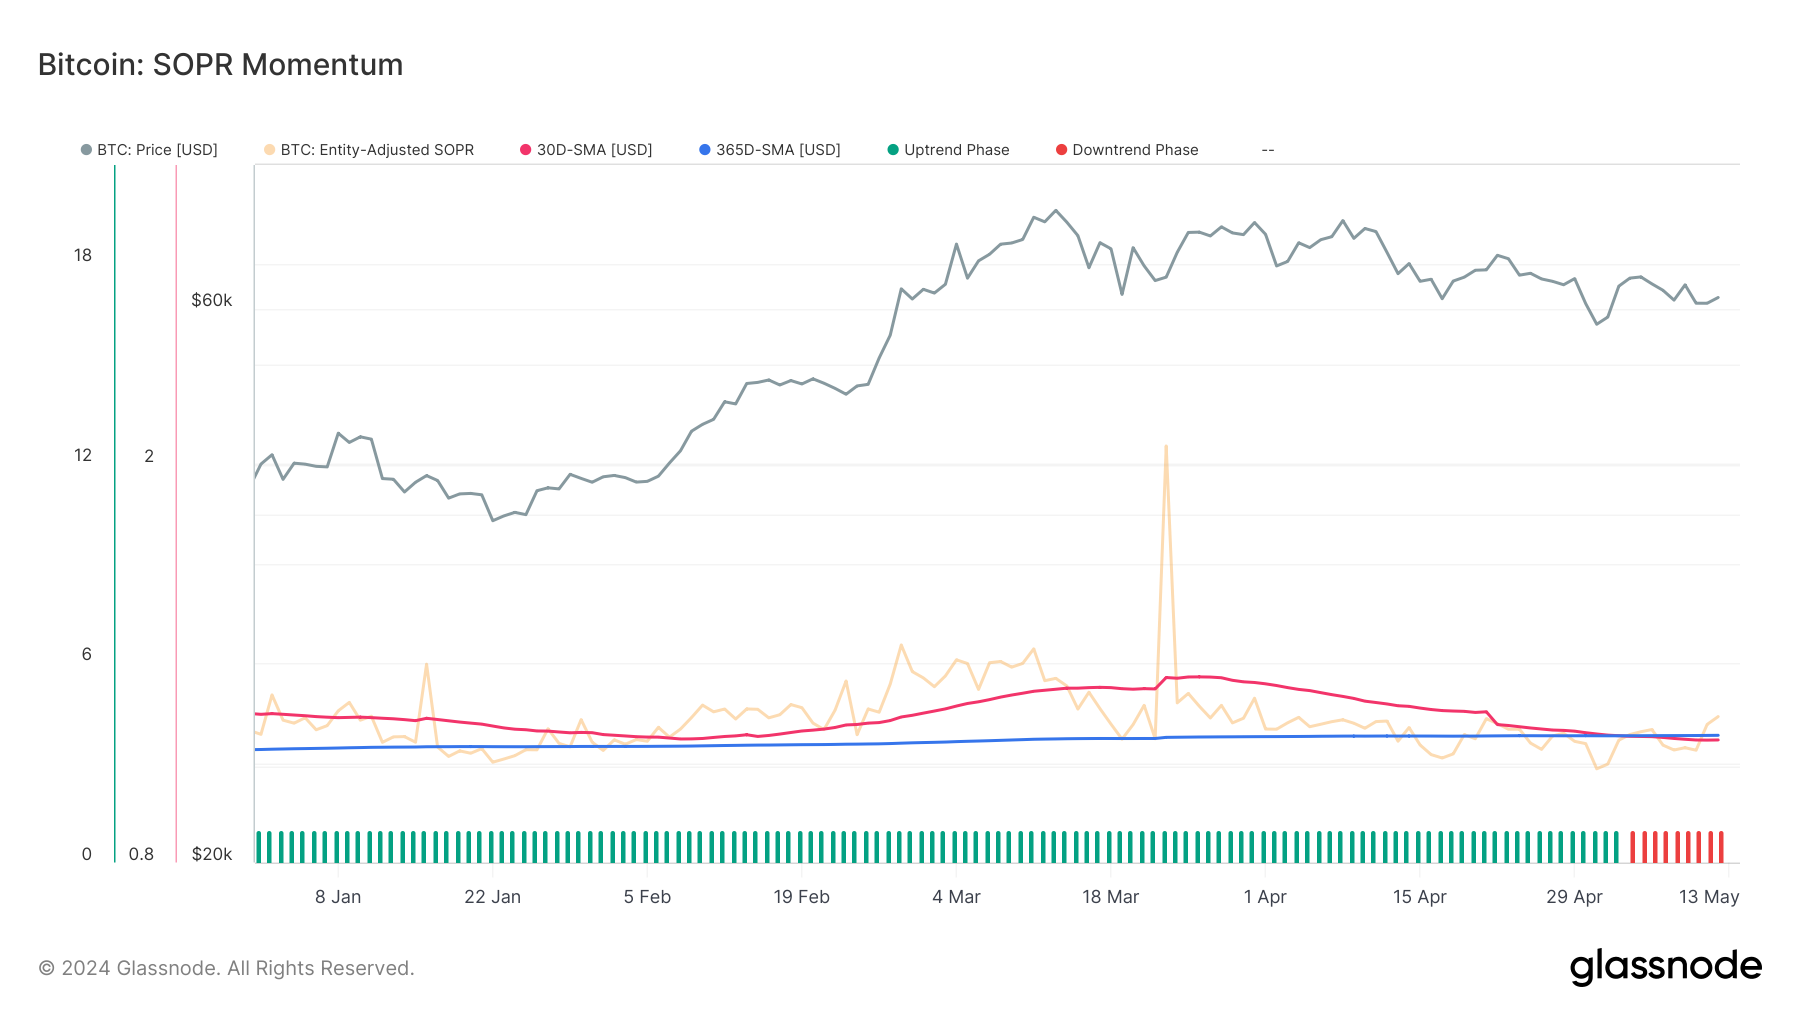
- SOPR Momentum: The Spent Output Profit Ratio (SOPR) Momentum is also trending downward, with the monthly average recently dropping below the yearly average. This trend is not yet strong but indicates that the profitability of transacted coins is decreasing, which could lead to more cautious spending behaviour among traders.
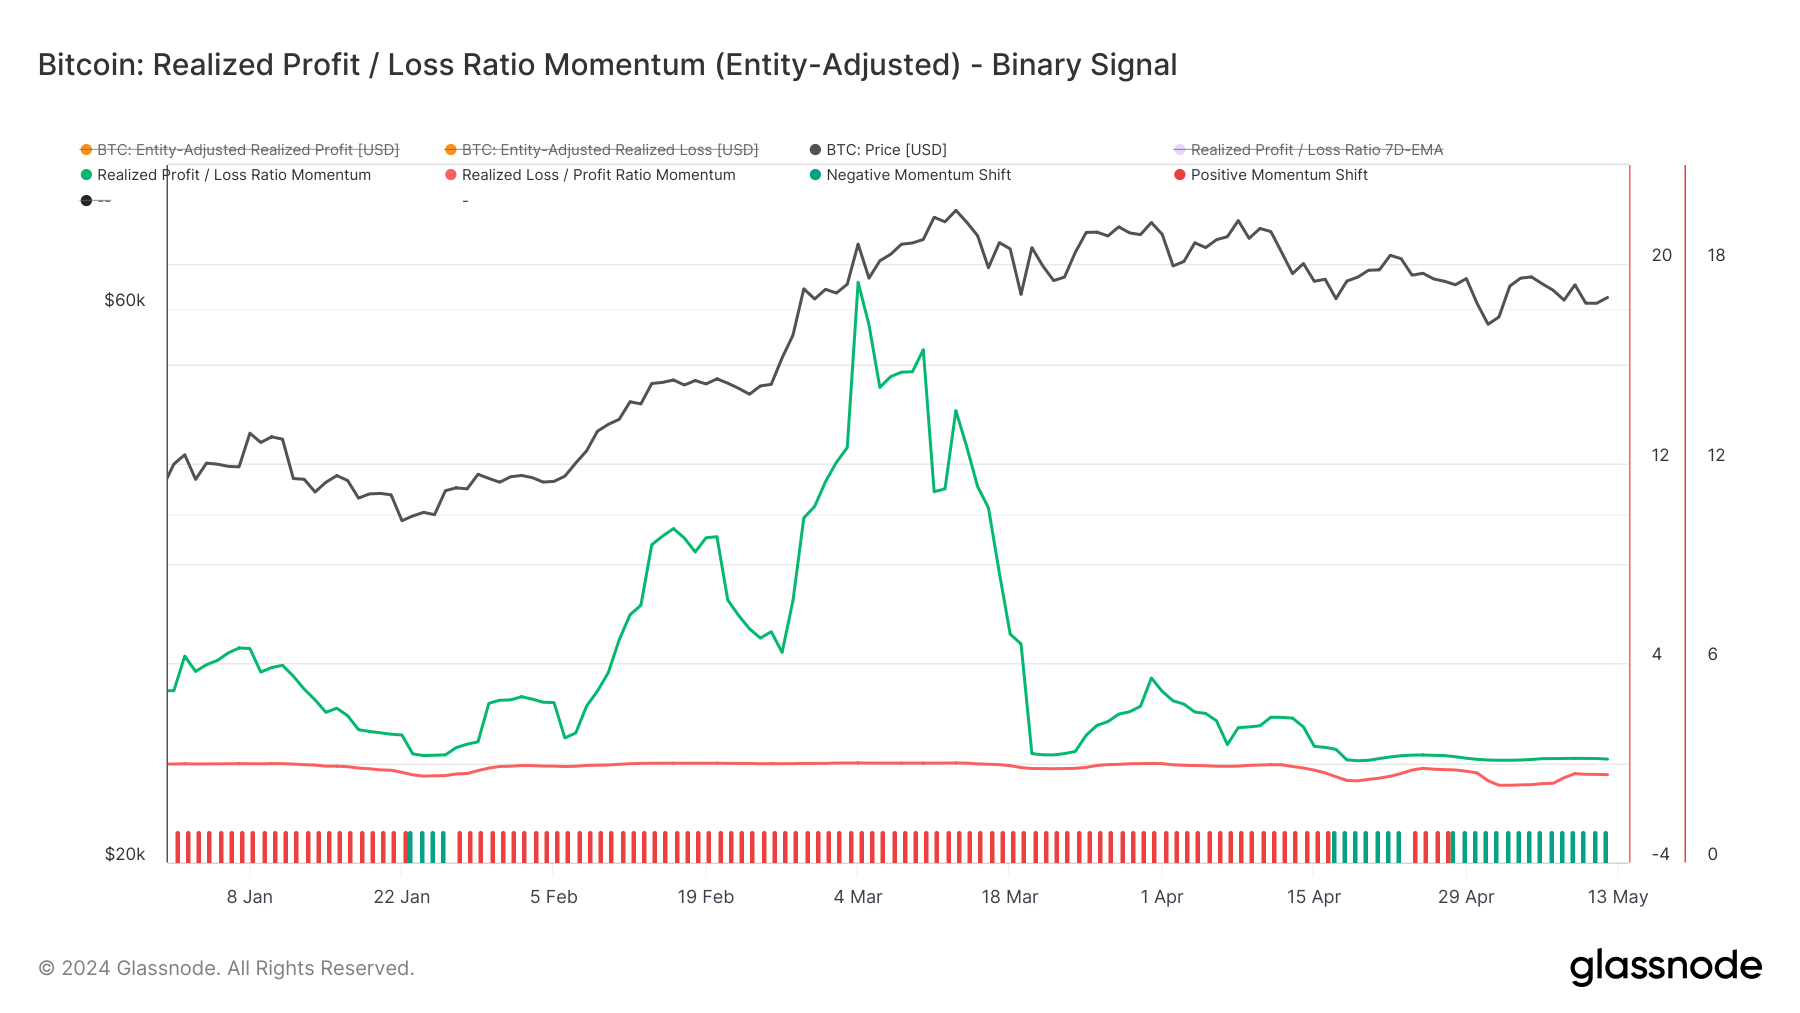
- Realized Profit / Loss Ratio Momentum: A shift towards negative momentum in this metric highlights that realized losses have accelerated during recent market corrections. This increase in losses for recent coin purchasers could potentially trigger a panic sell-off if the market continues to correct.
Conclusions and Actionable Insight for Momentum Traders
The current market indicators suggest that Bitcoin is experiencing a phase of consolidation and potential correction. With key metrics like Exchange Inflow Volume, SOPR Momentum, and Short-Term Holder MVRV indicating a slowdown in positive momentum and an increase in selling pressure, traders should be cautious. The shift in Miner Revenue and the cooling of SOPR Momentum further suggest that demand for Bitcoin at higher price levels may be waning.
For momentum traders, it’s essential to monitor these downtrends closely. The potential for reversals in metrics like SOPR and Supply in Profit may provide strategic entry points if signs of recovery or stabilization emerge. However, the increasing realized losses highlight the need for vigilance against potential panic selling.
Metric Spotlight: Miner Revenue Momentum
In our analysis of Market Momentum trends, we have highlighted the Miner Revenue Momentum. This metric uses the proportion of miner revenue earned from fees to gauge blockspace demand. Fee pressure increases when users express heightened urgency and are willing to pay higher fees for inclusion in the next block. By applying a 2-Year rolling Z-Score to this data, we can standardize the dataset across cycles and spot inflexion points, such as upticks in fees during a waning bear market or declines after a cycle peak.
By examining the Miner Revenue Momentum, analysts can gauge the intensity of network activity and its implications for miner behaviour. A high Z-score suggests that miners are experiencing above-average revenue, often coinciding with increased transaction fees and heightened network congestion. Conversely, a declining Z-score indicates reduced demand for block space, which can signal a cooling market or decreased transaction activity.

- Trend to Look For: Elevated miner revenue often corresponds with bullish market phases, as high demand for block space typically reflects increased transaction activity and network utilization. Conversely, a declining miner revenue momentum may suggest waning interest and potential market consolidation.
- Historical Example: Miner Revenue Momentum spiked significantly in the days following the April 2024 halving, driven by intense competition for block space. Similar spikes were observed during previous halvings and major network events, serving as indicators of robust market activity. The current downtrend in the Z-score marks a shift from this peak, suggesting a potential easing of speculative fervour.
- Metric Variations: Percent Miner Revenue from Fees, Miner Revenue from Fees Z-Score Ribbon, Miner Capitulation Risk
Get Personalised Insights
We hope that Finance Bridge continues to provide valuable insights and helps you navigate the crypto landscape more effectively.
If you have an idea about how we could improve this newsletter to make it more practical for you, we invite you to engage with us. Do you have any questions about the content of this issue or any other queries? Would you like to connect directly with our team of analysts? Or are you interested in discovering how you can leverage Glassnode’s full potential?
Don’t hesitate to reach out. Your thoughts and insights will help us continue to improve the quality of our services and this newsletter, so we’re genuinely excited to hear from you. Schedule a call with a dedicated member of our Institutional sales team to begin the conversation.
Disclaimer: This report does not provide any investment advice. All data is provided for information and educational purposes only. No investment decision shall be based on the information provided here and you are solely responsible for your own investment decisions.

- SEO Powered Content & PR Distribution. Get Amplified Today.
- PlatoData.Network Vertical Generative Ai. Empower Yourself. Access Here.
- PlatoAiStream. Web3 Intelligence. Knowledge Amplified. Access Here.
- PlatoESG. Carbon, CleanTech, Energy, Environment, Solar, Waste Management. Access Here.
- PlatoHealth. Biotech and Clinical Trials Intelligence. Access Here.
- Source: https://insights.glassnode.com/finance-bridge-post-halving-blues/
- :has
- :is
- :not
- :where
- 1
- 1800
- 19
- 2000
- 2016
- 2020
- 2024
- 28
- 31
- 37
- 4
- 8
- 90
- a
- About
- above
- Absolute
- accelerated
- access
- Accounting
- acquired
- across
- Act
- Action
- actionable
- activity
- acts
- adaptability
- Additional
- additional yield
- Adoption
- advice
- affect
- After
- aftermath
- against
- age
- aggregate
- All
- all-time highs
- allows
- also
- Although
- Amid
- among
- amount
- an
- analysis
- Analysts
- Analytical
- and
- annual
- annum
- Anticipated
- anticipation
- any
- Apply
- Applying
- approach
- approvals
- approximately
- April
- April 2024
- ARE
- argue
- around
- articles
- AS
- assess
- Assessing
- asset
- At
- average
- averaging
- Balance
- balancing
- base
- based
- basis
- BE
- Bear
- Bear Market
- became
- become
- been
- began
- begin
- Beginning
- begun
- behaviour
- below
- between
- Beyond
- bias
- Billion
- binance
- Bitcoin
- Bitcoin halving
- Bitcoin market
- Bitcoin Network
- Bitcoin supply
- bitcoin's price
- Block
- Blues
- Boosted
- both
- bought
- Breakdown
- BRIDGE
- broader
- BTC
- budget
- bull
- Bull Market
- Bull Run
- Bullish
- but
- Buy-Side
- Buying
- by
- CAN
- cap
- capability
- capital
- capitulation
- capture
- categories
- Category
- cautious
- centre
- Changes
- characteristics
- characterized
- Charts
- clients
- closely
- Coin
- Coins
- come
- community
- compared
- competition
- compounded
- compromise
- Concerns
- conditions
- congestion
- Connect
- consistent
- consolidation
- content
- continuation
- continue
- continued
- continues
- Conversation
- conversely
- correct
- Corrections
- correctly
- corresponds
- Cost
- cost basis
- Costs
- could
- coverage
- Creating
- critical
- crypto
- crypto investing
- crypto landscape
- cryptocurrency
- cryptocurrency markets
- Current
- Current state
- Currently
- Customers
- cycle
- cycles
- Cyclical
- daily
- data
- day
- Days
- debate
- debates
- decentralized
- Decentralized Finance
- decision
- decisions
- Decline
- Declines
- Declining
- decrease
- decreased
- decreasing
- dedicated
- DeFi
- defi sector
- Delta
- Demand
- demands
- derivative
- Derivatives
- derivatives trading
- Despite
- detailed
- Development
- developments
- DID
- digital
- Digital Asset
- dilemma
- diminishing
- direction
- directly
- disappointment
- discovering
- distributions
- do
- does
- Dominance
- dominate
- dominated
- downward
- driven
- Dropping
- due
- during
- dynamics
- earned
- easing
- ecosystem
- edition
- educational
- effect
- effectively
- effects
- efficient
- EMA
- emerge
- emotions
- encourage
- engage
- enhance
- ensuring
- entered
- entrants
- entry
- essential
- ETF
- ETFs
- ETH
- Ether (ETH)
- ethereum
- Ethereum ecosystem
- Ethereum's
- Even
- Event
- events
- evolve
- examine
- Examining
- example
- exceeding
- exchange
- excited
- existing
- expanding
- expansion
- experienced
- experiencing
- express
- extensive
- faced
- factors
- fee
- Fees
- few
- fewer
- Figure
- finance
- Find
- First
- first time
- Flows
- fluctuations
- focusing
- followed
- following
- For
- Force
- found
- four
- Fourth
- fraction
- Framework
- from
- full
- function
- Fundamentals
- further
- future
- gaining
- Gains
- gateway
- gauge
- genuinely
- geopolitical
- Glassnode
- Global
- Go
- Gold
- governance
- Group
- Growing
- Growth
- guided
- Halving
- hand
- happen
- Hard
- Hardware
- Hashrate
- Have
- healthy
- hear
- heightened
- Held
- help
- helped
- helps
- here
- High
- higher
- Highlight
- Highlighted
- highlighting
- highlights
- Highs
- historical
- historically
- holder
- holders
- holding
- Holdings
- hope
- How
- How To
- However
- HTTPS
- idea
- identifies
- identify
- if
- immediate
- Impact
- implications
- important
- impressive
- improve
- in
- Incentives
- inclusion
- Increase
- increased
- Increases
- increasing
- index
- indicate
- indicated
- indicates
- indicating
- Indicator
- Indicators
- inflation
- Inflection
- inflows
- influence
- information
- informed
- initially
- Innovation
- innovations
- insight
- insights
- Institutional
- institutional clients
- Integrating
- intense
- intensified
- interest
- interested
- internal
- into
- introduced
- introducing
- invested
- investing
- investment
- investor
- Investors
- invite
- involving
- issuance
- issue
- IT
- ITS
- itself
- Keep
- Key
- landscape
- largely
- Last
- Late
- lead
- leading
- LEARN
- less
- Level
- levels
- Leverage
- like
- likely
- Liquid
- liquid staking
- live
- local
- logging
- Long
- long-term
- long-term holders
- Look
- loss
- losses
- Lows
- Macroeconomic
- maintain
- maintaining
- major
- make
- March
- marked
- marker
- Market
- market sentiment
- market share
- market value
- Markets
- May..
- meaningful
- Meanwhile
- measures
- member
- met
- metric
- Metrics
- might
- Milestones
- million
- mined
- miner
- Miners
- Momentum
- Monetary
- Monetary Policy
- money
- Monitor
- Month
- monthly
- months
- more
- most
- movements
- MVRV
- Navigate
- navigates
- navigating
- Near
- necessary
- Need
- needed
- needs
- negative
- net
- network
- New
- New Market
- newly
- Newsletter
- next
- Next Block
- no
- norms
- notable
- now
- nuanced
- NUPL
- observe
- observed
- of
- off
- Offers
- often
- on
- On-Chain
- on-chain data
- ongoing
- only
- operational
- opponents
- opportunities
- optimized
- or
- original
- Other
- our
- out
- outflows
- output
- over
- overall
- overview
- own
- Panic
- participants
- participation
- particular
- particularly
- past
- Pay
- Peak
- peaked
- per
- performance
- period
- periods
- Personalised
- phase
- phases
- platform
- Platforms
- plato
- Plato Data Intelligence
- PlatoData
- points
- policy
- pool
- portion
- position
- positive
- potential
- potentially
- power
- Practical
- premier
- pressure
- pressures
- prevailing
- prevent
- previous
- price
- PRICE ACTION
- Prices
- primarily
- primary
- Profit
- profitability
- profits
- projects
- Proof-of-Stake
- proponents
- proportion
- proposed
- protect
- protocols
- proven
- provide
- provided
- providers
- provides
- purchasers
- purposes
- quality
- queries
- Questions
- ranging
- rapid
- Rate
- Rates
- ratio
- RE
- reach
- reached
- reaction
- realized
- realizing
- recent
- recently
- recovery
- Reduced
- reducing
- reduction
- reflecting
- reflective
- reflects
- Regardless
- reinforced
- remained
- remains
- report
- requires
- research
- Resistance
- responsible
- restrictions
- revenue
- Reversal
- reversals
- reverse
- rigorous
- rising
- robust
- Role
- Rolling
- Run
- s
- safeguard
- sales
- same
- saw
- Scalability
- scalable
- Scarcity
- sector
- security
- see
- seems
- seen
- selecting
- sell-off
- Selling
- Sensitivity
- sentiment
- Services
- serving
- Settled
- settlement
- several
- shaped
- shaping
- Share
- shift
- Shifts
- short-term
- Short-term holder
- should
- show
- showed
- showing
- shown
- Signal
- signals
- significant
- significantly
- Signs
- similar
- since
- Size
- slightly
- slow
- Slowdown
- Slowing
- small
- So
- solely
- Soon
- SOPR
- Space
- speculative
- Spending
- spent
- spike
- spikes
- Spot
- Spot Trading
- Spotlight
- spots
- staggering
- Staked
- stakeholders
- Staking
- staking pool
- Starting
- State
- statistics
- Status
- Still
- store
- store of value
- Strategic
- strength
- strive
- strong
- studio
- subsided
- subsidy
- substantial
- successful
- such
- sufficient
- suggest
- Suggests
- suite
- supply
- Supported
- surge
- surpassed
- Surrounding
- sustained
- T
- Take
- team
- technological
- tend
- tensions
- term
- terms
- than
- that
- The
- The Future
- the information
- the security
- their
- Them
- There.
- These
- they
- this
- this year
- those
- time
- to
- Tokens
- Total
- toward
- towards
- trade
- Traders
- Trading
- trading volume
- trading volumes
- transaction
- Transaction Fees
- Transactions
- transfer
- transferred
- Trend
- trending
- Trends
- trigger
- Trillion
- two
- typically
- u.s.
- Uncertain
- uncertainties
- Uncertainty
- underlying
- underscored
- underscores
- understanding
- unprecedented
- upcoming
- Update
- uptrend
- urgency
- us
- User
- users
- uses
- utilization
- Valuable
- value
- valued
- various
- Versus
- via
- vigilance
- vision
- Volatility
- volume
- volumes
- Wallet
- was
- we
- Wealth
- week
- Weeks
- were
- when
- which
- while
- WHO
- will
- willing
- with
- within
- would
- year
- yearly
- years
- yet
- Yield
- you
- Your
- zephyrnet