- The US Producer Price Index (PPI) for June rose below estimates, suggesting a steady deceleration of inflation in the US.
- Initial Jobless Claims in the US were lower than estimated, although the focus remains on the Fed’s inflation targets.
- The UK missed a recession, though fears reignited as the Bank of England is expected to tighten monetary conditions.
GBP/USD rallies past the 1.3100 mark and is gaining close to 1% on Thursday, as overall US Dollar (USD) weakness extended amid speculations the Federal Reserve (Fed) is closing to finishing its tightening cycle after June’s PPI and CPI data was softer than expected. The GBP/USD is exchanging hands at 1.3111 after hitting a daily low of 1.2979.
Rising speculations of Fed’s tightening cycle ending spurs Sterling gains
GBP/USD accelerated its gains after the US Bureau of Labor Statistics (BLS) revealed that prices paid by producers, also known as the Producer Price Index (PPI) in June, rose below estimates, suggesting the deflation process in the US is gathering pace. PPI rose by 0.1% YoY, below forecasts of 0.4%, down ticked from May 1.1%. Core PPI, which strips volatile items, showed signs of losing steam and expanded at a 2.4% YoY pace, below estimates of 2.6% and the previous month’s 2.8%.
At the same time, the BLS informed that Initial Jobless Claims for the week ending July 5 climbed less than estimates of 250K, standing at 237K. Even though the data portrays a tight labor market, investors ignored it, as the Fed’s primary focus remained on inflation.
Despite the inflation downtrend continuing, the Federal Reserve is estimated to raise rates by 25 bps at the upcoming July meeting. However, bets for the rest of the year, paired as shown by November’s odds standing at 21%, according to CME FedWatch Tool.
On the UK front, the UK economy dodged a recession, as UK’s GDP growth for the last 3-months came at 0%, while month-over-month (MoM) figures in May dropped -0.1%, trailing April’s 0.2% expansion. Although the economy didn’t grow, concerns of a recession loom, as the Bank of England (BoE) is set to tighten monetary policy to curb high inflation at 8.6 percent levels.
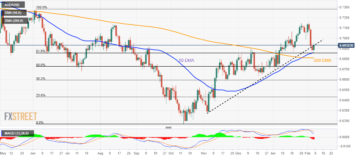
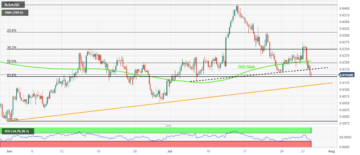
GBP/USD Price Analysis: Technical outlook

the GBP/USD is set to test the 2021 yearly low of 1.3160 after storming through the 1.3000 figure, which didn’t last long enough, to refrain buyers from committing to open fresh long bets, that Sterling (GBP) would continue to edge higher. A decisive break above the former could put the 1.3200 figure on the table; otherwise, a healthy correction could send the pair dipping towards the 1.3100 psychological level before diving to July 12 daily high at 1.3000. Of note, the Relative Strength Index (RSI) is at overbought conditions, still shy of reaching the 80 levels, usually used as the extreme overbought area, after an asset witnessed a strong uptrend.
- SEO Powered Content & PR Distribution. Get Amplified Today.
- PlatoData.Network Vertical Generative Ai. Empower Yourself. Access Here.
- PlatoAiStream. Web3 Intelligence. Knowledge Amplified. Access Here.
- PlatoESG. Automotive / EVs, Carbon, CleanTech, Energy, Environment, Solar, Waste Management. Access Here.
- BlockOffsets. Modernizing Environmental Offset Ownership. Access Here.
- Source: https://www.fxstreet.com/news/gbp-usd-rally-breaks-13100-barrier-amid-soft-us-ppi-data-202307131828
- :is
- 1
- 12
- 2%
- 2021
- 25
- 250K
- 3000
- 8
- 80
- a
- above
- accelerated
- According
- After
- also
- Although
- Amid
- an
- analysis
- and
- AREA
- AS
- asset
- At
- Bank
- Bank of England
- barrier
- before
- below
- Bets
- BoE
- Break
- breaks
- Bureau
- bureau of labor statistics
- buyers
- by
- came
- Chart
- claims
- Climbed
- Close
- closing
- CME
- committing
- Concerns
- conditions
- continue
- continuing
- Core
- could
- CPI
- CPI data
- curb
- cycle
- daily
- data
- decisive
- deflation
- Dollar
- down
- dropped
- economy
- Edge
- England
- enough
- estimated
- estimates
- Even
- exchanging
- expanded
- expansion
- expected
- extreme
- fears
- Fed
- Federal
- federal reserve
- Figure
- Figures
- Focus
- For
- forecasts
- Former
- fresh
- from
- front
- gaining
- Gains
- gathering
- GBP
- GBP/USD
- GDP
- gdp growth
- Grow
- Growth
- Hands
- healthy
- High
- High inflation
- higher
- hitting
- However
- HTTPS
- in
- index
- inflation
- inflation targets
- informed
- initial
- Investors
- IT
- items
- ITS
- jobless claims
- July
- june
- known
- labor
- labor market
- Last
- less
- Level
- levels
- Long
- loom
- losing
- Low
- lower
- mark
- Market
- May..
- meeting
- missed
- mom
- Monetary
- Monetary Policy
- note
- Odds
- of
- on
- open
- otherwise
- overall
- Pace
- paid
- pair
- paired
- past
- percent
- plato
- Plato Data Intelligence
- PlatoData
- policy
- portrays
- ppi
- previous
- price
- Price Analysis
- Prices
- primary
- process
- producer
- Producers
- put
- raise
- rallies
- rally
- Rates
- reaching
- recession
- relative
- relative strength index
- Relative Strength Index (RSI)
- remained
- remains
- Reserve
- REST
- Revealed
- ROSE
- rsi
- same
- send
- set
- showed
- shown
- Signs
- Soft
- statistics
- steady
- Steam
- sterling
- Still
- strength
- strong
- table
- targets
- Technical
- test
- than
- that
- The
- the UK
- though?
- Through
- thursday
- tighten
- tightening
- time
- to
- tool
- towards
- Uk
- upcoming
- uptrend
- us
- US Dollar
- US PPI
- US Producer Price Index
- USD
- used
- usually
- volatile
- was
- weakness
- week
- were
- which
- while
- witnessed
- would
- year
- yearly
- zephyrnet