- GBP/USD had a strong bullish week, with the main catalyst being US inflation.
- The dollar remained close to its lowest point in 15 months.
- US consumer prices experienced their slowest growth in over two years.
The GBP/USD weekly forecast appears to be positive as there are indications of inflation easing, which should lead to a continuation of the current trend of dollar weakness.
Ups and downs of GBP/USD
GBP/USD had a strong bullish week, with the main catalyst being US inflation. Moreover, the pair rose amid rising expectations for Bank of England rate hikes.
-Are you interested in learning about forex tips? Click here for details-
The US released consumer and producer price inflation figures last week that showed declining price pressures. The dollar remained close to its lowest point in 15 months, boosting the pound. US inflation data made investors optimistic about a looming end to Fed hikes.
On Wednesday, data revealed that US consumer prices experienced their slowest growth in over two years. Additionally, data on Thursday showed the smallest rise in US producer inflation in almost three years.
Next week’s key events for GBP/USD
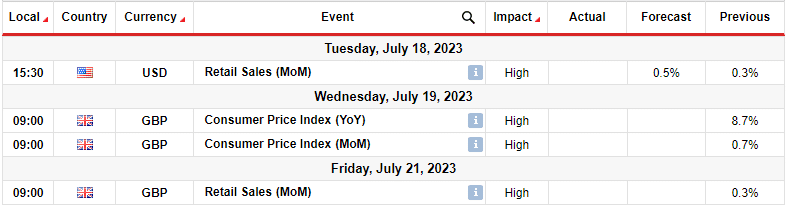
The upcoming week will feature minimal major economic releases. The US and the UK will disclose information regarding retail sales. Furthermore, the UK will release inflation data.
The retail sales data will indicate the performance of consumer spending in the US and the UK amidst increasing interest rates. As consumer spending is pivotal in propelling economies, unexpectedly high sales can alter the projected outlook for Fed and BOE interest rates.
On the other hand, the inflation report from the UK could be a major catalyst for the pair. The UK still struggles with high inflation, pushing up rate hike expectations. This has seen the pound rise recently and could continue next week.
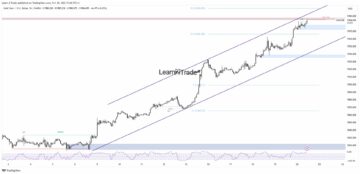
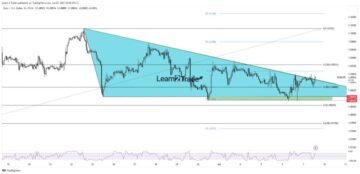
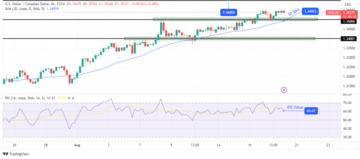
GBP/USD weekly technical forecast: Bulls may pause at 1.3203 resistance.

The bias for GBP/USD on the daily chart is bullish because the price has made a higher high above the 22-SMA. Moreover, the RSI is overbought, which mostly happens when the price is in an uptrend. Bulls first made a higher low at the 22-SMA and the 1.2601 support zone before breaking above the previous high near the 1.2850 resistance level.
-Are you interested in learning about the forex basics? Click here for details-
The price is approaching the next resistance level at 1.3203, where it might pause. After a big swing, bulls might take profits at the next resistance, leading to a short consolidation or pullback. However, soon the price will keep rising.
Looking to trade forex now? Invest at eToro!
68% of retail investor accounts lose money when trading CFDs with this provider. You should consider whether you can afford to take the high risk of losing your money
Read Next
- SEO Powered Content & PR Distribution. Get Amplified Today.
- PlatoData.Network Vertical Generative Ai. Empower Yourself. Access Here.
- PlatoAiStream. Web3 Intelligence. Knowledge Amplified. Access Here.
- PlatoESG. Automotive / EVs, Carbon, CleanTech, Energy, Environment, Solar, Waste Management. Access Here.
- BlockOffsets. Modernizing Environmental Offset Ownership. Access Here.
- Source: https://www.forexcrunch.com/gbp-usd-weekly-forecast-buyers-active-amid-eased-us-inflation/
- :has
- :is
- :where
- $UP
- 1
- 15%
- 167
- 30
- 300
- a
- About
- above
- Accounts
- active
- Additionally
- afford
- After
- Amid
- amidst
- an
- and
- approaching
- ARE
- AS
- At
- Bank
- Bank of England
- BE
- because
- before
- being
- bias
- Big
- BoE
- boosting
- Breaking
- Bullish
- Bulls
- buyers
- CAN
- Catalyst
- CFDs
- Chart
- click
- Close
- Consider
- consolidation
- consumer
- Container
- continuation
- continue
- could
- Current
- cycle
- daily
- data
- Declining
- Disclose
- Dollar
- downs
- easing
- Economic
- economies
- end
- England
- events
- expectations
- experienced
- Feature
- Fed
- fed hikes
- Figures
- First
- For
- Forecast
- forex
- from
- Furthermore
- GBP/USD
- Growth
- had
- hand
- happens
- here
- High
- High inflation
- higher
- Hike
- Hikes
- However
- HTTPS
- in
- increasing
- indicate
- indications
- inflation
- inflation figures
- information
- interest
- Interest Rates
- interested
- Invest
- investor
- Investors
- IT
- ITS
- Keep
- Key
- Last
- lead
- leading
- learning
- Level
- looming
- lose
- losing
- Low
- lowest
- made
- Main
- major
- max-width
- May..
- might
- minimal
- money
- months
- Moreover
- mostly
- Near
- next
- next week
- now
- of
- on
- Optimistic
- or
- Other
- Outlook
- over
- pair
- pause
- performance
- pivotal
- plato
- Plato Data Intelligence
- PlatoData
- Point
- positive
- pound
- pressures
- previous
- price
- Prices
- producer
- profits
- projected
- propelling
- provider
- pullback
- Pushing
- Rate
- Rate Hike
- rate hikes
- Rates
- recently
- regarding
- release
- released
- Releases
- remained
- report
- Resistance
- retail
- Retail Sales
- Revealed
- Rise
- rising
- Risk
- ROSE
- ROW
- rsi
- sales
- seen
- Short
- should
- showed
- smallest
- Soon
- Spending
- Still
- strong
- Struggles
- support
- SVG
- Swing
- Take
- Technical
- that
- The
- the UK
- their
- There.
- this
- three
- thursday
- to
- trade
- Trading
- Trend
- two
- Uk
- upcoming
- UPS
- uptrend
- us
- us inflation
- weakness
- Wednesday
- week
- weekly
- when
- whether
- which
- will
- with
- years
- you
- Your
- zephyrnet