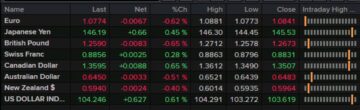
The Fed members and Fed
Chair Powell keep on repeating that they expect two or more rate hikes if the
data remains strong. Since the last FOMC meeting, the data kept on surprising
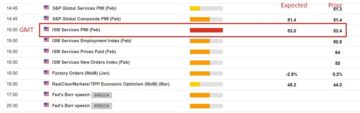
to the upside with very strong housing market indicators, solid US Jobless Claims, US Services PMI in expansion and a strong consumer confidence report. This has led to a more
hawkish repricing in interest rates expectations that ultimately favoured the
US Dollar.
The BoE surprised with a 50 bps rate
hike last week as
the incredibly strong employment report and a higher than expected core
inflation figure made the central bank to lean for a more aggressive action. BoE’s Bailey has also said that they will do
what is necessary to achieve their target and will be data dependent for rate
hikes.
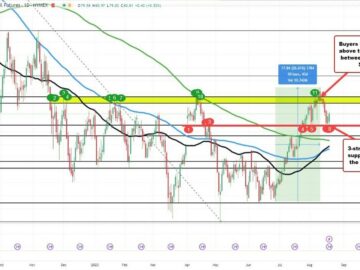
GBPUSD Technical Analysis –
Daily Timeframe
GBPUSD Daily
On the daily chart, we can see that GBPUSD has fell
below the 1.2680 support with
conviction. We may now see the buyers waiting at the upward trendline to pile
in with a defined risk below to target a new high. The sellers, on the other
hand, will want to see the price breaking below the trendline to start getting
aggressive on the downside and target the 1,23 swing low.
GBPUSD Technical Analysis –
4 hour Timeframe
GBPUSD 4 hour
On the 4 hour chart, we can see that we have some
strong support levels near the trendline where we can find the 50% Fibonacci retracement level
and the previous resistance turned support. The
trend on this timeframe has been bearish as the price kept on printing lower
lows and lower highs, but the downside momentum is starting to weaken right
when we are getting near the trendline. It may be a sign of an incoming
pullback or reversal.
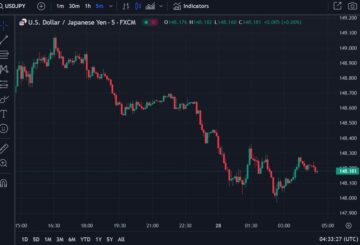
GBPUSD Technical Analysis –
1 hour Timeframe
GBPUSD 1 hour
On the 1 hour chart, we can see that the
price is in fact diverging with
the MACD which
is generally a sign of weakening momentum often followed by pullbacks or
reversals. So, we may expect another push to the downside and then a deeper
pullback into the 1.2680 resistance or the price breaking below the trendline
with conviction invalidating the bullish setup and opening the door for a fall
into the 1.23 handle. Alternatively, the buyers may also start to pile in as
soon as the price breaks above the 1.2680 resistance. Today, the risk event
to watch is the US PCE and we might get some dollar weakness if the data misses
expectations and some strength if the data beats.
See also the video below:
- SEO Powered Content & PR Distribution. Get Amplified Today.
- PlatoData.Network Vertical Generative Ai. Empower Yourself. Access Here.
- PlatoAiStream. Web3 Intelligence. Knowledge Amplified. Access Here.
- PlatoESG. Automotive / EVs, Carbon, CleanTech, Energy, Environment, Solar, Waste Management. Access Here.
- BlockOffsets. Modernizing Environmental Offset Ownership. Access Here.
- Source: https://www.forexlive.com/technical-analysis/gbpusd-technical-analysis-us-dollar-strength-20230630/
- :has
- :is
- :where
- 1
- 23
- 50
- a
- above
- Achieve
- Action
- aggressive
- also
- an
- analysis
- and
- Another
- ARE
- AS
- At
- Bank
- BE
- bearish
- been
- below
- Breaking
- breaks
- Bullish
- but
- buyers
- by
- CAN
- central
- Central Bank
- Chair
- Chart
- conviction
- Core
- daily
- data
- deeper
- defined
- dependent
- do
- Dollar
- Door
- downside
- employment
- Event
- expansion
- expect
- expectations
- expected
- fact
- Fall
- Fed
- Figure
- Find
- follow
- followed
- FOMC
- For
- generally
- get
- getting
- hand
- handle
- Have
- Hawkish
- High
- higher
- Highs
- Hikes
- hour
- HTTPS
- if
- in
- Incoming
- incredibly
- inflation
- interest
- Interest Rates
- into
- IT
- jpg
- Keep
- kept
- Last
- Led
- Level
- levels
- Low
- lower
- Lows
- made
- Market
- May..
- meeting
- Members
- might
- misses
- Momentum
- more
- Near
- necessary
- New
- now
- of
- often
- on
- opening
- or
- Other
- pce
- plato
- Plato Data Intelligence
- PlatoData
- Powell
- previous
- price
- printing
- pullback
- Push
- Rate
- rate hikes
- Rates
- remains
- report
- Resistance
- Reversal
- right
- Risk
- Said
- see
- Sellers
- Services
- setup
- sign
- since
- So
- solid
- some
- Soon
- start
- Starting
- strength
- strong
- support
- support levels
- surprised
- surprising
- Swing
- Target
- Technical
- Technical Analysis
- than
- that
- The
- their
- then
- they
- this
- timeframe
- to
- Trend
- Turned
- two
- Ultimately
- Upside
- upward
- us
- US Dollar
- very
- Video
- Waiting
- want
- Watch
- we
- weakness
- week
- What
- What is
- when
- which
- will
- with
- zephyrnet