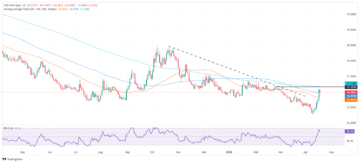
- Gold Price remains in the hands of the bulls at the start of the week.
- US consumer Price Index and a disinflationary economic backdrop are fueling the Gold price higher.
- US Dollar remains under pressure and is embarking on a fresh bear cycle low.
Gold price has been holding in at the bull cycle highs of $1,920 following last week’s volatility that was driven by the Consumer Price Index, CPI, that fuelled a sell-off in the US Dollar, supporting risk assets and the Gold price higher.
Risk markets have been aided by expectations of slower interest rate hikes from the United States Federal Reserve. Market participants are mostly expecting a 25 basis points (bps) rate hike increase at the Federal Reserve’s next policy meeting. Such an outcome would be expected to keep the bulls in play as a lower rates environment tends to be beneficial for the non-yielding Gold price. This is also supported by strong buying from central banks with China adding 30 trillion to its Gold reserves in December, according to analysts at ANZ Bank.
Federal Reserve underestimated?
However, after the Consumer Price Index, last week, analysts at Brown Brothers Harriman, BBH, stated in a note their opinion that the market is underestimating the potential for a higher for longer Federal Reserve.
”Core Personal Consumption Expenditures, PCE, has largely been in a 4.5-5.5% range since November 2021,” they said. ”We think the Federal Reserve needs to see further improvement before even contemplating any sort of pivot.”
The analysts, at the time, noted that the WIRP, (world interest rate probabilities), suggested a 25 bp hike on February 1 was fully priced in, with nearly 30% odds of a larger 50 bp move. They also noted that another 25 bp hike on March 22 is fully priced in, while one last 25 bp hike in the second quarter is nearly 45% priced in that would take the Fed Funds rate ceiling up to 5.25%. ”However,” they said, ”the swaps market continues to price in an easing cycle by year-end and we just don’t see that happening.”
In a more recent commentary, analysts at TD Securities argued that ”while the precious metal space is no longer in a selling mode, there continues to be correction risk as it is not all certain that inflation has been defeated and that the US central bank is ready to get less restrictive anytime soon.”
Federal Reserve officials remain hawkish
Federal Reserve’s Patrick Harker said 25 bp hikes will be appropriate going forward as the days of 75 bp are “surely behind us.” However, the analysts at BBH explained while this might sound dovish, he added that he expects “a few more” rate hikes this year.
”It’s often difficult to parse Fed-speak but “a few” likely means four; “several” implies three; “a couple” means two. To us, “a few” implies a Fed Funds ceiling of 5.5% vs. 4.5% currently,” the analysts said. Elsewhere, James Bullard said the Fed should get rates above 5% as soon as possible and keep them there.
Federal Reserve speakers this week will be John Williams, Raphael Bostic, Patrick Harker, Lorie Logan Susan Collins and Lael Brainard.
For the week ahead, we also have the Federal Reserve’s Beige Book report Wednesday. ”Most indicators suggest further slowing in the real economy as well as lower price and wage pressures,” the analysts at BBH said. ”However, labour market data suggests ongoing robustness in hiring and we think that will ultimately limit the drop in average hourly earnings.”Overall, the analysts expect the Beige Book to paint a mixed picture of the economy that suggests a willingness to continue tightening if data warrant.
Gold technical analysis
In this week’s pre-open Gold price analysis, Gold, Chart of the Week: XAU/USD meets $1,920 resistance area, eyes on 4-hour structures to the downside, it was explained that the Gold price bears need to get the market on the backside of the 4-hour trendline as follows:
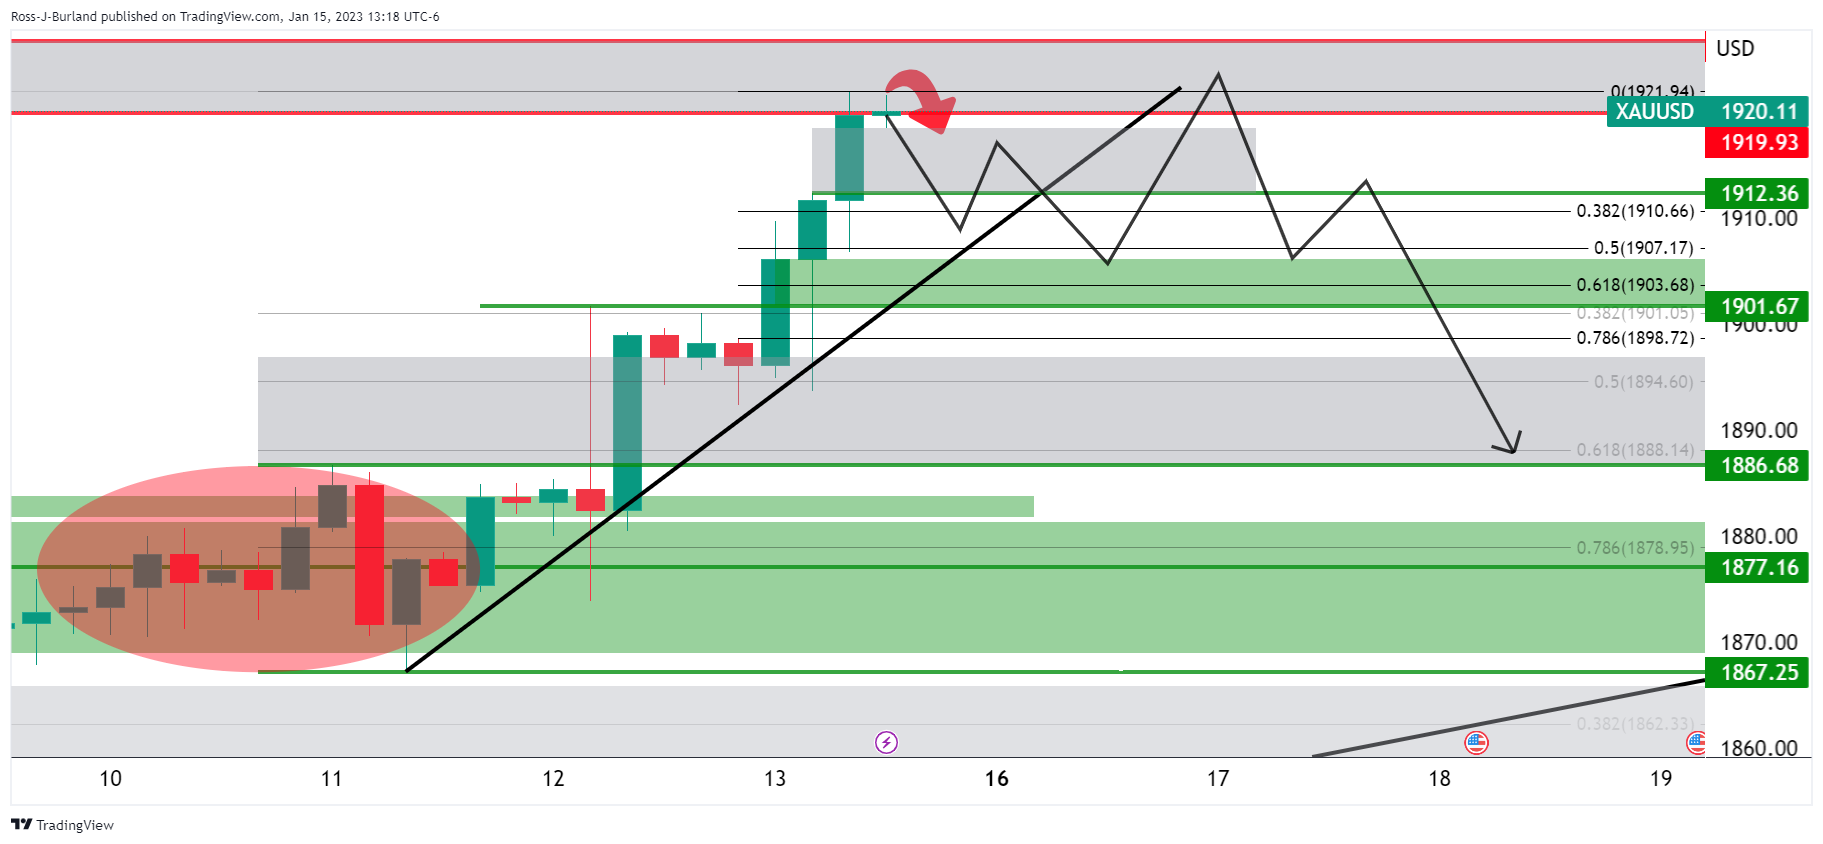
The above Gold price schematic is typical of such a breakdown and deceleration of the trend, in a) breaking the trendline, b) retesting the peak formation highs and c), eventually breaking the horizontal support structure.
- SEO Powered Content & PR Distribution. Get Amplified Today.
- Platoblockchain. Web3 Metaverse Intelligence. Knowledge Amplified. Access Here.
- Source: https://www.fxstreet.com/news/gold-price-forecast-xau-usd-bulls-continue-to-chip-away-at-1-920-resistance-202301160153
- 1
- 2021
- a
- above
- According
- added
- After
- All
- Analysts
- and
- Another
- appropriate
- AREA
- Assets
- average
- backdrop
- Bank
- Banks
- basis
- Bear
- Bears
- before
- behind
- beneficial
- book
- BP
- Breakdown
- Breaking
- brothers
- Brown Brothers Harriman
- bull
- Bulls
- Buying
- ceiling
- central
- Central Bank
- Central Banks
- certain
- Chart
- China
- chip
- Collins
- Commentary
- consumer
- consumer price index
- consumption
- continue
- continues
- Couple
- CPI
- Currently
- data
- Days
- December
- difficult
- Dollar
- Dont
- Dovish
- Drop
- Earnings
- easing
- Economic
- economy
- elsewhere
- Ether (ETH)
- Even
- eventually
- expectations
- expected
- expects
- explained
- Eyes
- Fed
- Federal
- federal reserve
- few
- following
- follows
- Forecast
- formation
- Forward
- fresh
- from
- fully
- funds
- further
- get
- going
- Gold
- gold price
- Hands
- higher
- Highs
- Hike
- Hikes
- Hiring
- holding
- Horizontal
- However
- HTTPS
- improvement
- in
- Increase
- index
- inflation
- interest
- INTEREST RATE
- INTEREST RATE HIKES
- IT
- John
- Keep
- Labour
- Lael Brainard
- largely
- larger
- Last
- likely
- LIMIT
- Logan
- longer
- Low
- March
- Market
- Market Data
- Markets
- means
- meeting
- Meets
- metal
- might
- mixed
- Mode
- more
- most
- move
- nearly
- Need
- needs
- next
- noted
- November
- November 2021
- Odds
- ONE
- ongoing
- Opinion
- overall
- paint
- participants
- pce
- Peak
- personal
- picture
- Pivot
- plato
- Plato Data Intelligence
- PlatoData
- Play
- points
- policy
- possible
- potential
- Precious
- pressure
- price
- price forecast
- range
- Rate
- Rate Hike
- rate hikes
- Rates
- ready
- real
- recent
- remain
- remains
- report
- Reserve
- reserves
- Resistance
- Restrictive
- Risk
- risk assets
- robustness
- Said
- Second
- Securities
- sell-off
- Selling
- several
- should
- since
- Slowing
- Soon
- Sound
- Space
- speakers
- start
- stated
- States
- strong
- structure
- such
- Suggests
- support
- Supported
- Supporting
- Susan
- Swaps
- Take
- TD
- TD Securities
- Technical
- The
- the Fed
- their
- this week
- this year
- three
- tightening
- time
- to
- Trend
- typical
- Ultimately
- under
- United
- United States
- United States Federal Reserve
- us
- US Central Bank
- US Dollar
- Volatility
- wage
- Warrant
- Wednesday
- week
- while
- will
- Willingness
- world
- would
- XAU/USD
- year
- zephyrnet