- Gold price attracts some dip-buying on Thursday amid geopolitical risk and a softer USD.
- Reduced bets for an early Fed rate cut act as a tailwind for the buck and should cap gains.
- Traders now look to the US Q4 GDP print for some impetus ahead of the US PCE on Friday.
Gold price (XAU/USD) ticks higher during the Asian session on Thursday and reverses a part of the previous day’s heavy losses to a multi-day low, albeit it lacks bullish conviction. The US Dollar (USD) struggles to capitalize on the overnight bounce from over a one-week low and remains below its highest level since December 13 touched on Tuesday. This, along with the risk of a further escalation of military action in the Middle East, turn out to be key factors lending support to the safe-haven precious metal.
Meanwhile, the upbeat release of the flash US PMI prints on Wednesday reaffirms the view that the economy is in good shape and forces investors to further scale back their expectations for an early interest rate cut by the Federal Reserve (Fed). This, in turn, remains supportive of elevated US Treasury bond yields and acts as a headwind for the non-yielding Gold price. Traders might also prefer to wait on the sidelines ahead of the European Central Bank (ECB) meeting and the Advance US Q4 GDP report.
Daily Digest Market Movers: Gold price draws support from geopolitical risks, delayed Fed rate cut bets act as a headwind
- The US Dollar bulls remain on the defensive, which, along with geopolitical tensions stemming from conflicts in the Middle East, lend some support to the safe-haven Gold price.
- Iran-backed Houthi rebels in Yemen targeted two US-owned commercial ships sailing close to the Gulf of Aden on Wednesday in the face of multiple rounds of US military airstrikes.
- This comes after the US military carried out pre-emptive strikes against the Houthis to stave off what it said was an imminent attack on shipping lanes in the important Red Sea trade route.
- The S&P Global flash US Composite PMI Output Index increased to 52.3 this month, or the highest since June, suggesting that the economy kicked off 2024 on a stronger note.
- The flash US Manufacturing PMI rebounded from 47.9 to a 15-month high of 50.3 in January, while the gauge for the services sector climbed to 52.9, or the highest reading since last June.
- The data further pointed to a still-resilient US economy and forced investors to further pare their bets for a more aggressive monetary policy easing by the Federal Reserve in 2024.
- The yield on the benchmark 10-year US government bond hovers near the monthly peak, which should act as a tailwind for the Greenback and cap gains for the non-yielding yellow metal.
- The Advance US Q4 GDP print is due this Thursday and is expected to show that growth in the world’s largest economy slowed to a 2% annualized pace from 4.9% in the previous quarter.
- Thursday’s US economic docket also features the release of Durable Goods Orders and the usual Weekly Initial Jobless Claims, which might influence the Greenback and the XAU/USD.
- Apart from this, the outcome of the highly-anticipated European Central Bank meeting might infuse volatility in the markets and produce short-term trading opportunities.
- The market focus, meanwhile, will remain glued to the US Personal Consumption Expenditures Price Index data – the Fed’s preferred inflation gauge – on Friday.
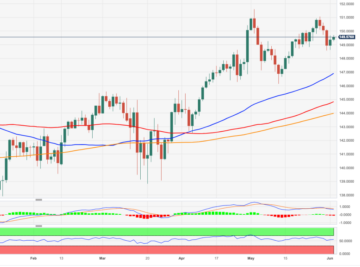
Technical Analysis: Gold price bears might wait for a sustained break below the $2,000 mark before placing fresh bets
From a technical perspective, the recent repeated failures near the $2,040-2,042 supply zone and the overnight downfall favour bearish traders. Moreover, oscillators on the daily chart have just started gaining negative traction and suggest that the path of least resistance for the Gold price is to the downside. That said, it will still be prudent to wait for some follow-through selling below the $2,000 psychological mark before positioning for any further losses. The XAU/USD might then accelerate the slide towards the $1,988 intermediate support en route to the 100-day Simple Moving Average (SMA), currently around the $1,975-1,974 area, and the 200-day SMA, near the $1,964-1,963 region.
On the flip side, immediate resistance is pegged near the $2,025 zone, or the 50-day SMA, above which the Gold price could climb back to the $2,040-2.042 barrier. A sustained strength beyond the latter might trigger a short-covering rally and lift the Gold price to the $2,077 area. The momentum could extend further and allow bulls to aim back to reclaim the $2,100 round-figure mark.
US Dollar price today
The table below shows the percentage change of US Dollar (USD) against listed major currencies today. US Dollar was the weakest against the .
| USD | EUR | GBP | CAD | AUD | JPY | NZD | CHF | |
| USD | 0.01% | 0.03% | -0.07% | -0.02% | 0.07% | -0.04% | 0.16% | |
| EUR | -0.01% | 0.03% | -0.09% | -0.05% | 0.06% | -0.07% | 0.14% | |
| GBP | -0.04% | -0.03% | -0.11% | -0.07% | 0.02% | -0.10% | 0.12% | |
| CAD | 0.07% | 0.08% | 0.11% | 0.04% | 0.11% | 0.02% | 0.23% | |
| AUD | 0.03% | 0.03% | 0.05% | -0.05% | 0.10% | -0.03% | 0.19% | |
| JPY | -0.06% | -0.06% | -0.03% | -0.14% | -0.10% | -0.14% | 0.09% | |
| NZD | 0.09% | 0.05% | 0.08% | -0.02% | 0.03% | 0.13% | 0.19% | |
| CHF | -0.16% | -0.15% | -0.13% | -0.23% | -0.17% | -0.08% | -0.20% |
The heat map shows percentage changes of major currencies against each other. The base currency is picked from the left column, while the quote currency is picked from the top row. For example, if you pick the Euro from the left column and move along the horizontal line to the Japanese Yen, the percentage change displayed in the box will represent EUR (base)/JPY (quote).
Gold FAQs
Gold has played a key role in human’s history as it has been widely used as a store of value and medium of exchange. Currently, apart from its shine and usage for jewelry, the precious metal is widely seen as a safe-haven asset, meaning that it is considered a good investment during turbulent times. Gold is also widely seen as a hedge against inflation and against depreciating currencies as it doesn’t rely on any specific issuer or government.
Central banks are the biggest Gold holders. In their aim to support their currencies in turbulent times, central banks tend to diversify their reserves and buy Gold to improve the perceived strength of the economy and the currency. High Gold reserves can be a source of trust for a country’s solvency. Central banks added 1,136 tonnes of Gold worth around $70 billion to their reserves in 2022, according to data from the World Gold Council. This is the highest yearly purchase since records began. Central banks from emerging economies such as China, India and Turkey are quickly increasing their Gold reserves.
Gold has an inverse correlation with the US Dollar and US Treasuries, which are both major reserve and safe-haven assets. When the Dollar depreciates, Gold tends to rise, enabling investors and central banks to diversify their assets in turbulent times. Gold is also inversely correlated with risk assets. A rally in the stock market tends to weaken Gold price, while sell-offs in riskier markets tend to favor the precious metal.
The price can move due to a wide range of factors. Geopolitical instability or fears of a deep recession can quickly make Gold price escalate due to its safe-haven status. As a yield-less asset, Gold tends to rise with lower interest rates, while higher cost of money usually weighs down on the yellow metal. Still, most moves depend on how the US Dollar (USD) behaves as the asset is priced in dollars (XAU/USD). A strong Dollar tends to keep the price of Gold controlled, whereas a weaker Dollar is likely to push Gold prices up.
- SEO Powered Content & PR Distribution. Get Amplified Today.
- PlatoData.Network Vertical Generative Ai. Empower Yourself. Access Here.
- PlatoAiStream. Web3 Intelligence. Knowledge Amplified. Access Here.
- PlatoESG. Carbon, CleanTech, Energy, Environment, Solar, Waste Management. Access Here.
- PlatoHealth. Biotech and Clinical Trials Intelligence. Access Here.
- Source: https://www.fxstreet.com/news/gold-price-languishes-near-weekly-low-ahead-of-us-gdp-geopolitics-lend-support-202401250315
- :has
- :is
- ][p
- $UP
- 000
- 1
- 100
- 13
- 2%
- 2022
- 2024
- 33
- 41
- 50
- 9
- a
- above
- accelerate
- According
- Act
- Action
- acts
- added
- advance
- After
- against
- aggressive
- ahead
- aim
- airstrikes
- allow
- along
- also
- Amid
- an
- analysis
- and
- Animate
- annualized
- any
- apart
- ARE
- AREA
- around
- AS
- asian
- asset
- Assets
- attack
- Attracts
- average
- back
- Bank
- Banks
- barrier
- base
- BE
- bearish
- Bears
- been
- before
- began
- below
- Benchmark
- Bets
- Beyond
- Biggest
- Billion
- bond
- Bond yields
- both
- Bounce
- Box
- Break
- Bullish
- Bulls
- buy
- Buy Gold
- by
- CAN
- cap
- capitalize
- carried
- central
- Central Bank
- Central Banks
- change
- Changes
- China
- claims
- climb
- Climbed
- Close
- Column
- comes
- commercial
- conflicts
- considered
- consumption
- content
- controlled
- conviction
- correlated
- Correlation
- Cost
- could
- Council
- country’s
- currencies
- Currency
- Currently
- Cut
- daily
- data
- day
- December
- deep
- defensive
- Delayed
- depend
- Digest
- displayed
- diversify
- Doesn’t
- Dollar
- dollars
- down
- downfall
- downside
- draws
- due
- during
- each
- Early
- easing
- East
- ECB
- Economic
- economies
- economy
- elevated
- emerging
- enabling
- ends
- escalate
- escalation
- EUR
- Euro
- European
- European Central Bank
- example
- exchange
- expanded
- expectations
- expected
- extend
- Face
- factors
- failures
- FAQ
- favor
- fears
- Features
- Fed
- Federal
- federal reserve
- Flash
- Flip
- Focus
- For
- forced
- Forces
- fresh
- Friday
- from
- further
- gaining
- Gains
- gauge
- GDP
- geopolitical
- Geopolitics
- Global
- Gold
- gold price
- Gold Prices
- good
- goods
- Government
- Greenback
- Growth
- gulf
- Have
- heavy
- hedge
- High
- higher
- highest
- history
- holders
- Horizontal
- How
- HTTPS
- if
- immediate
- important
- improve
- in
- increased
- increasing
- index
- india
- inflation
- influence
- initial
- instability
- interest
- INTEREST RATE
- Interest Rates
- Intermediate
- investment
- Investors
- Issuer
- IT
- ITS
- January
- Japanese
- Japanese Yen
- jewelry
- jobless claims
- jpg
- june
- just
- Keep
- Key
- largest
- Last
- least
- left
- LEND
- lending
- Level
- likely
- Line
- Listed
- Look
- losses
- Low
- lower
- major
- make
- manufacturing
- map
- mark
- Market
- Markets
- meaning
- Meanwhile
- medium
- medium of exchange
- meeting
- metal
- Middle
- Middle East
- might
- Military
- module
- Momentum
- Monetary
- Monetary Policy
- money
- Month
- monthly
- more
- Moreover
- most
- move
- Movers
- moves
- moving
- moving average
- multiple
- Near
- negative
- note
- now
- of
- off
- on
- opportunities
- or
- orders
- Other
- out
- Outcome
- output
- over
- overnight
- Pace
- part
- path
- pce
- Peak
- pegged
- perceived
- percentage
- personal
- perspective
- pick
- picked
- placing
- plato
- Plato Data Intelligence
- PlatoData
- played
- pmi
- policy
- positioning
- Precious
- prefer
- preferred
- previous
- price
- Prices
- prints
- produce
- psychological
- purchase
- Push
- Quarter
- quickly
- quote
- rally
- range
- Rate
- Rates
- Reading
- reaffirms
- recent
- recession
- records
- Red
- region
- release
- rely
- remain
- remains
- repeated
- report
- represent
- Reserve
- reserves
- Resistance
- Rise
- Risk
- risk assets
- risks
- Role
- rounds
- Route
- ROW
- s
- S&P
- S&P Global
- Said
- sailing
- Scale
- SEA
- sector
- seen
- Selling
- Services
- session
- Shape
- shine
- Shipping
- ships
- short-term
- should
- show
- Shows
- side
- Simple
- since
- Slide
- slowed
- SMA
- Solvency
- some
- Source
- specific
- started
- starts
- Status
- Still
- stock
- stock market
- store
- store of value
- strength
- Strikes
- strong
- stronger
- Struggles
- such
- suggest
- supply
- support
- supportive
- sustained
- table
- Tailwind
- targeted
- Technical
- tends
- tensions
- that
- The
- the Fed
- the world
- their
- then
- this
- thursday
- times
- to
- today
- top
- touched
- towards
- traction
- trade
- Traders
- Trading
- Treasuries
- treasury
- trigger
- Trust
- Tuesday
- turbulent
- Turkey
- TURN
- two
- upbeat
- us
- US Dollar
- US economy
- US GDP
- us government
- US Manufacturing PMI
- US military
- us treasuries
- US Treasury
- Usage
- USD
- used
- usual
- usually
- value
- View
- Volatility
- wait
- was
- Wednesday
- weekly
- weighs
- What
- when
- whereas
- which
- while
- wide
- Wide range
- widely
- will
- with
- world
- World Gold Council
- worth
- XAU/USD
- yearly
- yellow
- Yen
- Yield
- yields
- you
- zephyrnet