
The High Tight Flag is a rare, extremely explosive chart pattern that often leads to triple-digit gains in a short period of time. Here, we walk through a recent trade in $UPST to show you how to clearly identify and earn massive profits from the High Tight Flag pattern.
In a bull market, most of the growth stocks we buy in The Wagner Daily model portfolio are breakout setups from a either a flat base or cup with handle chart pattern.
Both the base breakout and cup with handle patterns are relatively common in a bull market, but the High Tight Flag is uncommon.
Only a few stocks during any bull market are strong enough to form the rare High Tight Flag pattern.
However, taking the time to seek out this pattern is well worth your time!
If correctly identified, the High Tight Flag often leads to triple-digit gains within a short period of time.
Continue reading to discover key traits to help you properly identify and bag big gains from trading the High Tight Flag pattern.
How to spot the High Tight Flag pattern
The High Tight Flag pattern was first introduced in William O’Neil’s “must-read” classic, How to Make Money in Stocks.
Look for stocks with the following three key attributes to properly identify a High Tight Flag pattern:
- An explosive move of +100% or more in 8 weeks or less: The move is measured from the top of the last base (breakout level) up to the stock’s recent high. However, we measure from the start of the rally if there is a clear breakout from a lower resistance level (as in our $UPST example below). Avoid stocks that jump 100% in just one or two weeks merely due to a monster opening gap of around 40-50%.
- A shallow pullback (10-25% off the recent high) that is 3-5 weeks in length — An explosive move followed by a shallow consolidation is a big clue that the current rally may have a lot more gas left in the tank.
- Revolutionary technology or product — Although there are rare exceptions, most stocks that form a High Tight Flag pattern are associated with cutting-edge technology or products. Below are a few companies whose stocks formed this pattern in the past (source):
- Stun gun manufacturer Taser (now $AAXN) in 2003
- Mobile 4G LTE inventor Qualcomm ($QCOM) in 1999
- Birth control pill manufacturer Syntex in 1963
- TV maker Zenith in 1958
- AI lending platform Upstart ($UPST)–right now!
Note this third trait is not a requirement, but it helps put the odds in your favor.
Upstart ($UPST) forms a High Tight Flag pattern
Upstart ($UPST), a groundbreaking lending platform driven by artificial intelligence, recently formed a High Tight Flag pattern.
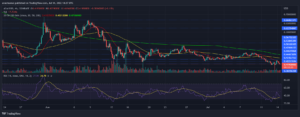
Let’s take a look at the daily chart:

The chart above shows the entire advance, as measured from the strong gap off the 50-day moving average (Aug. 11) up to the September high.
The rally from the gap up breakout to the September high was a massive advance of more than +140% in just seven weeks.
An explosive move of +100% or more in less than 8 weeks? CHECK!
Note the August 11 gap up was powerful, but not excessive.
The pullback (from Sept. 23 high to Oct. 4 low) was only 19% deep, and closed below the 20-day moving average for just one day before reversing higher.
A shallow pullback (10-25% off the recent high) that is 3-5 weeks in length? CHECK!
Well, the pullback was actually only two weeks long, but a shorter pullback is more bullish than a longer one.
Zooming out to the longer-term weekly chart makes the High Tight Flag pattern more recognizable.
As annotated on the chart, $UPST broke out of its base and rallied +140% over a seven-week period:
Finding the ideal entry point to buy a High Tight Flag pattern
We bought $UPST in the Wagner Daily report after identifying the High Tight Flag, and the initial entry is currently showing a gain of +18%.
Let’s walk through this real trade to show you the exact entry points we alerted subscribers to, and why we bought where we did.
10 cents above the high of the consolidation
The standard buy point for a High Tight Flag is 10 cents above the high of the consolidation base.
However, when possible, we prefer to enter a bit earlier with several partial buys to avoid buying a full position on the breakout.
Experience has taught us it can be psychologically challenging to hold a full position from the initial entry point because a false breakout sometimes precedes the real breakout.
Scaling in to the trade makes it easier to hold through a normal shakeout that often follows.
When the price action allows, we prefer to build a position with 2-3 partial buys.
This means we typically have no more than 20% to 30% of the position size near the obvious breakout point.
Our $UPST entry points on the High Tight Flag
Whenever we enter a new Wagner Daily trade, we notify subscribers of the exact percentage allocation in the Model Portfolio.
This enables members to mirror the proper size of any partial buys into a position.
We scaled in to $UPST with three separate buy entries, which are annotated on the daily chart below.
A text explanation with more details follows:

After identifying the High Tight Flag pattern, our first clue for the initial buy entry was the bullish reversal candle that formed on October 6 (figure “1”).
That candlestick reclaimed the 10 and 20-day exponential moving averages on increasing volume (bullish).
We did not buy on that day, but we added $UPST to the newsletter watchlist after the bullish reversal candlestick formed.
As the price pulled back to the 10-day EMA and found support, we bought our first partial position of $UPST on October 8 ($310.55).
We added to the position the following day ($314) as we received more bullish confirmation from the price breaking above a short-term downtrend line on the hourly chart.
We also liked that the prior day’s candlestick (October 8) was a tight-ranged inside day.
We finally entered our last part of the position on the breakout above the September high ($349).
As of the October 18 close, our buy entries are showing gains of +23%, +21%, and +10% respectively.
Exit strategy
Since the High Tight Flag pattern often leads to monstrous, triple-digit gains, we are not looking to sell $UPST for a quick 20% gain.
It can be a challenge to resist the urge to sell stocks that explode higher right out of the gate.
However, it’s crucial to let your winners ride as long as the price action remains bullish–especially with the rare High Tight Flag pattern.
To help us hold, we use shorter-term moving averages such as the 5-day EMA.
We fight the urge to sell partial size as long as the stock continues to close above its 5-day EMA.
We definitely do not want to sell the full position until there is either a break below the 10-day EMA, or some sort of climatic move to sell into strength–whichever comes first.
Subscribe now to The Wagner Daily to be instantly alerted when we take profits on this trade, and to receive your daily stock trade signals with exact entry and stop prices.
PS – If you’re a crypto trader (or want to learn how), check out our new Morpheus Crypto service for the hottest crypto trade signals and crypto trading room.
Source: http://feedproxy.google.com/~r/mtg-swing-trading/~3/nH2gsmaTevU/
- 11
- Action
- allocation
- Amazon
- around
- artificial intelligence
- AUGUST
- Bit
- breakout
- build
- Bullish
- buy
- Buying
- challenge
- closed
- Common
- Companies
- consolidation
- continues
- crypto
- crypto trading
- Current
- day
- DID
- driven
- EMA
- Figure
- Finally
- First
- form
- full
- gap
- GAS
- Growth
- here
- High
- hold
- How
- How To
- HTTPS
- identify
- image
- Intelligence
- Investors
- IT
- jump
- Key
- LEARN
- lending
- Level
- Line
- Long
- maker
- Manufacturer
- Market
- measure
- Members
- mirror
- model
- money
- move
- Near
- Pattern
- platform
- portfolio
- price
- Products
- profits
- qualcomm
- rally
- Reading
- report
- sell
- Short
- Size
- Spot
- start
- stock
- Stocks
- support
- Technology
- time
- top
- trade
- trader
- Trading
- Upstart
- us
- View
- volume
- weekly
- within
- worth