The world of blockchain has no shortage of opportunities. According to Footprint Analytics, nine major tokens (those in the top 100 market cap) did a 100x the past year.

Footprint Analytics – Major Tokens that Rose in Price 100x in the Past Year
While those new to crypto might see the market as a crapshoot, there are several metrics and methods investors can use to intelligently look for moonshot bets.
This article will focus on the five most important things to watch for when assessing a token for extreme growth potential. Whereas some analysts believe in chart watching and others prefer to analyse macro trends, we believe there is an important place for both qualitative and quantative methods – and Footprint Analytics can help you with both.
Market cap
The first thing people look at is the price of the token. However, a seasoned investor knows that the Market Cap is more important.
Market Cap is calculated by multiplying the token price by the token supply, and it represents the total value of the token. Simply put, it should always be the primary metric when assessing a token.

Footprint Analytics – market cap trend
The chart above indicated that all the high growth major tokens had long periods of a market cap greater than $10 million before their sudden price jumps. This indicates that you should look for coins with some sustained market viability. However, the flip side of this is that projects with market cap that are too high low probability of going up 100x.
We recommend tokens with a between $10 million and $50 million to balance potential risk when trying a high growth play.
Trading volume
A steady volume of transactions indicates that users are frequently trading tokens, which is one of the signs that a token is viable.
Most people will pay attention to the 24h and 7d trading rate of change. For example, Footprint Analytics helps us quickly find tokens with high market cap and token price increases.

Footprint Analytics – market cap growth rate ranking

Footprint Analytics – top tokens
The change rate can help us find tokens with high volume in a short period, but it is not enough, and we need to access with a more extended time.
Big whale swings in a short time may cause high volume growth, which may be fleeting, so we need to look at the trading volume for at least 7d or even 30d.
Let’s use Footprint Analytics to see the trading volume trends of some tokens.
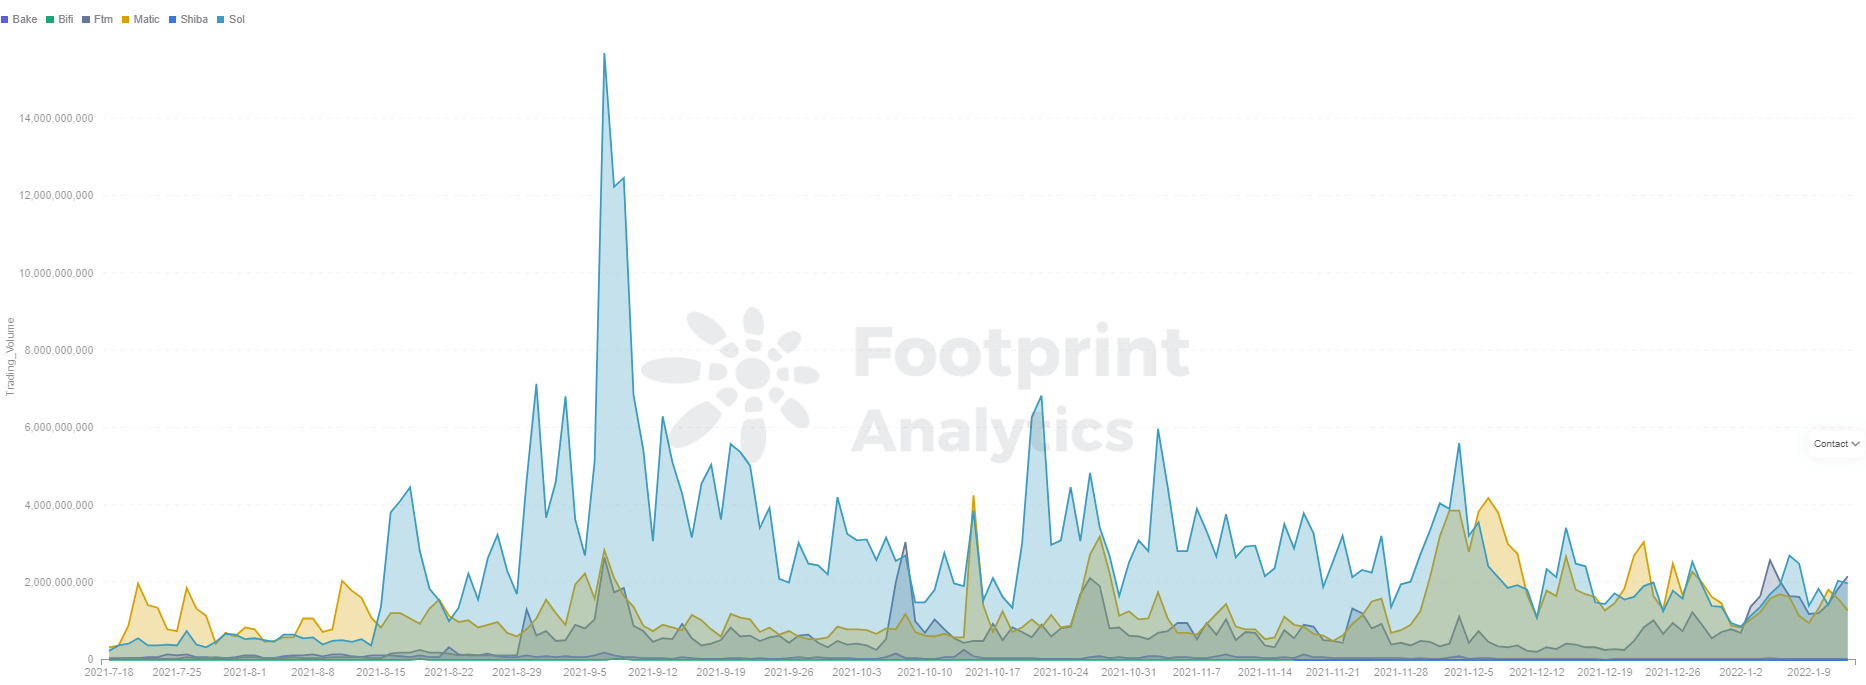
Footprint Analytics – top tokens trading volume
Take SOL as an example. Since August, SOL’s trading volume had peaked at $15.6 billion on September 7. But, most of the time, the trading volume fluctuated between $2 billion and $4 billion.
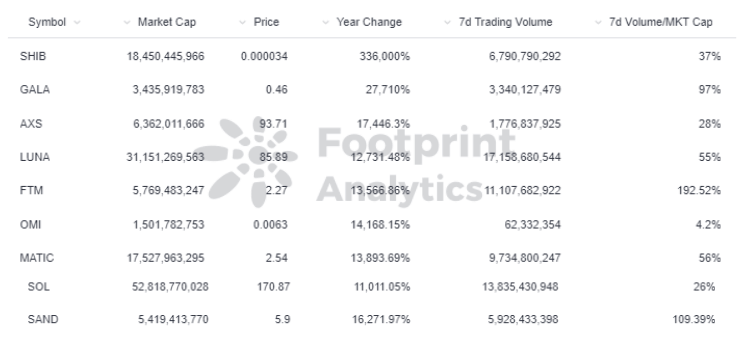
Footprint Analytics – top tokens trading volume and market cap
Of the top 100 tokens by market cap, 85% have 7d trading volume of no less than 20% of market cap.
A more significant correlation: 70% of 100X tokens with market cap above $10 million had 7d trading volumes consistently 20% of market cap.
Investment background
Venture capital often represents the expectations of the capital markets.

Footprint Analytics – Some DeFi projects invested by a16z
Most of the token prices of DeFi projects invested by a16z have seen promising increases. Jumping on the bandwagon of the portfolio of accomplished investors is one shortcut to vet projects.
Number of exchanges where token is live
If the token is listed on few or only small-sized exchanges, the exposure of the coin will be hindered and lead to a lack of liquidity.
For example, the top 10 100x coins by market cap last year were all live on no less than five exchanges.
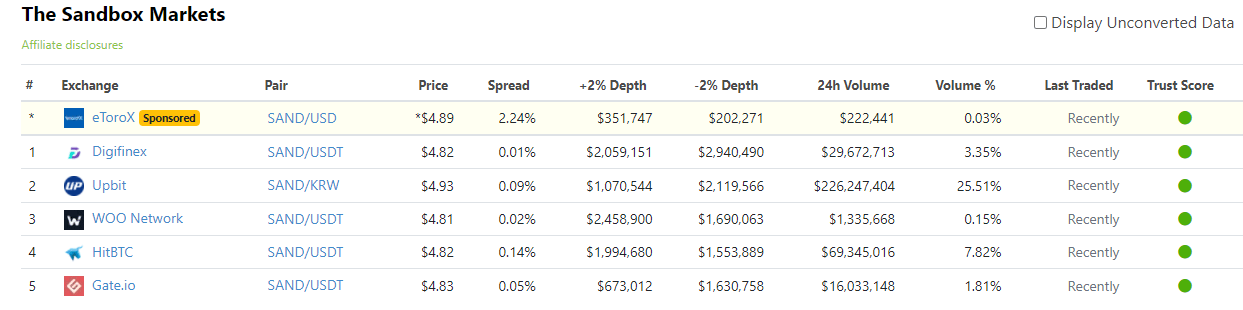
Footprint Analytics – The Sandbox (SAND) Market
You can check out the exchanges where a token is live in Coingecko.
Team background and capabilities
Technical strength…
You can check the frequency of code updates on GitHub, which reflects the iteration schedule and cycle of the project and whether the project is being optimised quickly and consistently.
Team background…
- Developer ratio: Contracts on the chain require strong development capabilities to support rapid iteration and prevent attacks. That’s why most projects have many developers on their teams. If the team members work primarily in marketing or administration, you may need to look more into their technical strengths.
- Team background: Having strong founders and resources is also an essential factor for a program to grow.
Summary of recommendations…
- Market Cap: $10m- $50m
- Trading volume: Above 20% of market cap on most previous weeks
- Financing: Funding rounds from established institutional investors
- Project fundamentals: Developer-heavy team with leadership with record of success
What is Footprint Analytics?
Footprint Analytics is an all-in-one analysis platform to visualise blockchain data and discover insights. It cleans and integrates on-chain data so users of any experience level can quickly start researching tokens, projects and protocols. With over a thousand dashboard templates plus a drag-and-drop interface, anyone can build their own customised charts in minutes. Uncover blockchain data and invest smarter with Footprint.
Footprint Website:https://www.footprint.network/
Discord:https://discord.gg/3HYaR6USM7
Twitter: https://twitter.com/Footprint_DeFi
Youtube: https://www.youtube.com/channel/UCKwZbKyuhWveetGhZcNtSTg
Source: https://coinrivet.com/how-to-find-the-next-100x-token-with-footprint-analytics/
- "
- 100
- 7
- access
- According
- All
- analysis
- analytics
- article
- AUGUST
- being
- Billion
- blockchain
- build
- capital
- Capital Markets
- Cause
- change
- Charts
- code
- Coin
- Coins
- contracts
- crypto
- dashboard
- data
- DeFi
- developers
- Development
- DID
- established
- example
- Exchanges
- experience
- First
- Focus
- Footprint
- Footprint Analytics
- founders
- Fundamentals
- funding
- GitHub
- going
- Grow
- Growth
- having
- help
- helps
- High
- How
- How To
- HTTPS
- important
- insights
- Institutional
- institutional investors
- Interface
- investor
- Investors
- IT
- lead
- Leadership
- Level
- Liquidity
- Listed
- Long
- Macro
- major
- Market
- Market Cap
- Marketing
- Markets
- Members
- Metrics
- million
- most
- opportunities
- Pay
- People
- platform
- Play
- portfolio
- price
- Program
- project
- projects
- record
- Resources
- Risk
- rounds
- sandbox
- seasoned
- Short
- significant
- Signs
- So
- start
- strong
- success
- supply
- support
- Technical
- time
- token
- Tokens
- top
- Trading
- Transactions
- Trends
- uncover
- Updates
- us
- users
- value
- volume
- Watch
- Work
- world
- year
- youtube