Color plays a crucial role in visualizations. It conveys meaning, captures attention, and enhances aesthetics. You can quickly grasp important information when key insights and data points pop with color. However, it’s important to use color judiciously to enhance readability and ensure correct interpretation. Color should also be accessible and consistent to enable users to establish visual patterns and comprehend data effectively.
In line with data visualization best practices, Amazon QuickSight is announcing the launch of field-based coloring options, which provides a fresh approach to configuring colors across visuals in addition to the visual-level color settings. With field-based colors, you can now enjoy the following benefits:
- Consistent coloring across visuals using the same Color field
- The ability to assign custom colors to dimension values at the field level
- The ability to persist default color consistency during visual interactions, such as filtering and sorting
Consistent coloring experience across visuals
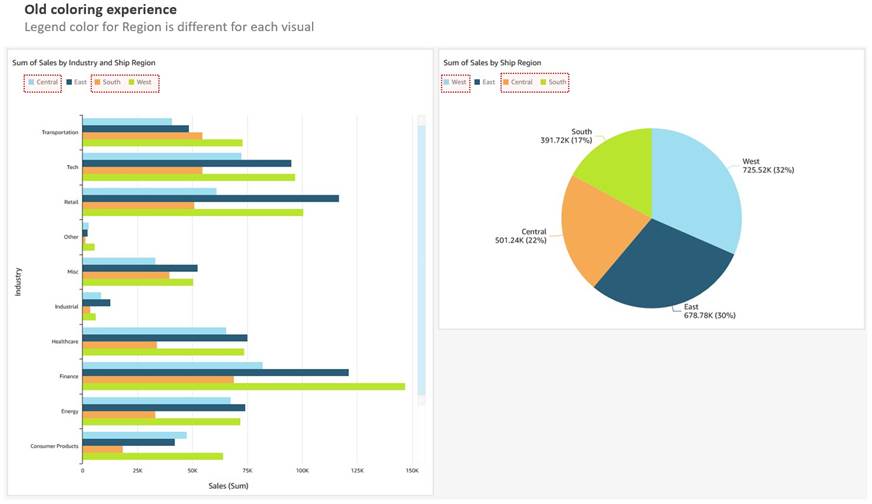
At present, users in QuickSight can either assign colors to their charts using themes or the on-visual menu. In addition to these options, the launch of field-based coloring allows authors to specify colors on a per-field basis, simplifying the process of setting colors and ensuring consistency across all visuals that use the same field. The following example shows that, before this feature was available, both charts using the color field Ship region displayed different colors across the field values.
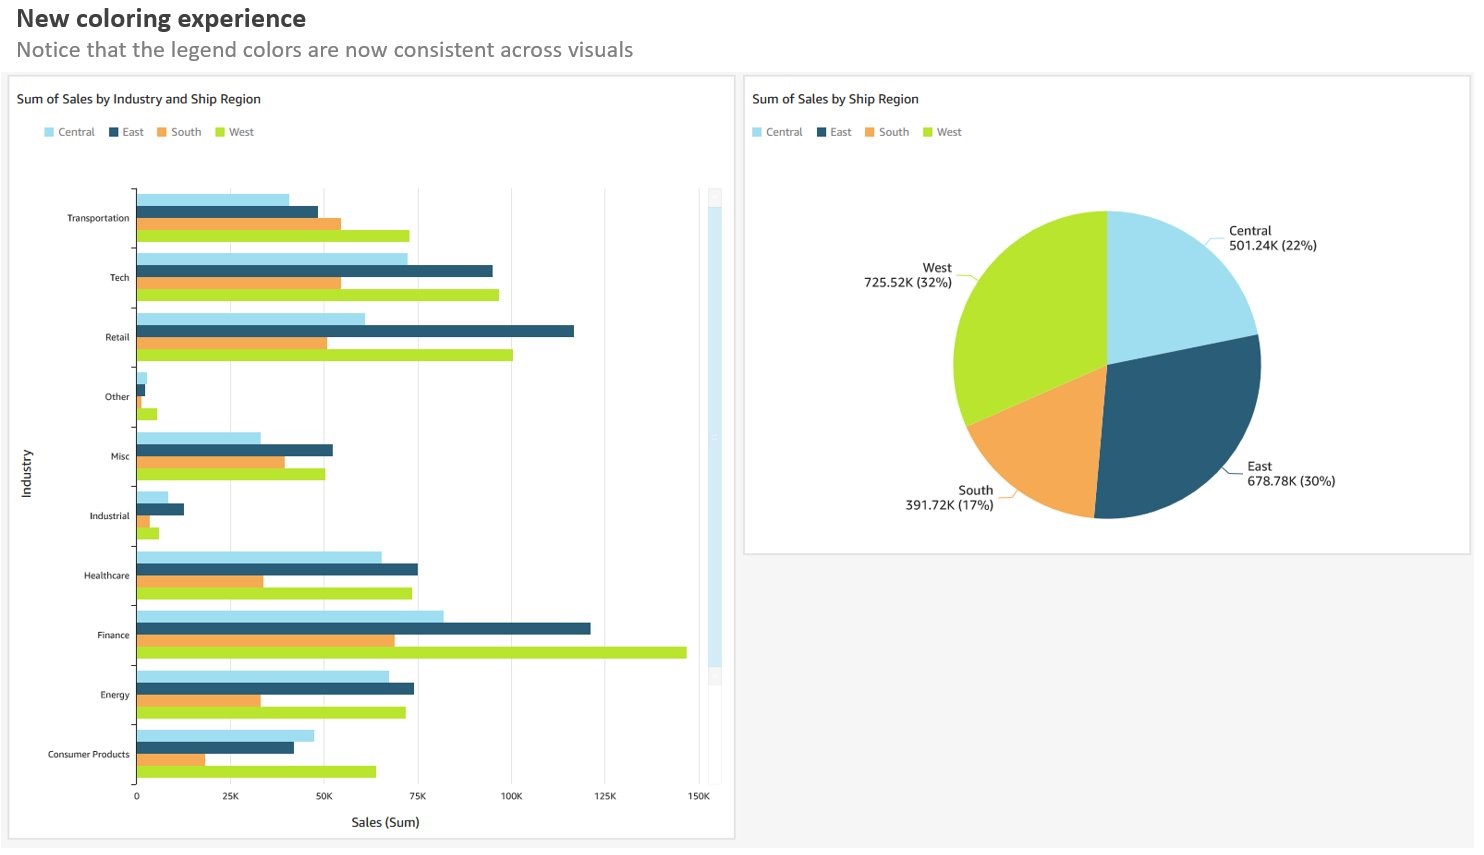
With the implementation of field colors, authors now have the capability to maintain consistent color schemes across visuals that utilize the same field. This is achieved by defining distinct colors for each field value, which ensures uniformity throughout. In contrast to the previous example, both charts now showcase consistent colors for the Ship region field.
Consistent coloring experience with visual interaction
In the past, the default coloring logic used to be based on the sorting order, which means that colors would stay the same for a given sort order. However, this caused inconsistency because the same values could display different colors when the sorting order changed or when they were filtered. The following example shows that the colors for each segment field (Online, In-Store, and Catalog) on the donut chart differ from the colors on the bar chart after sorting.
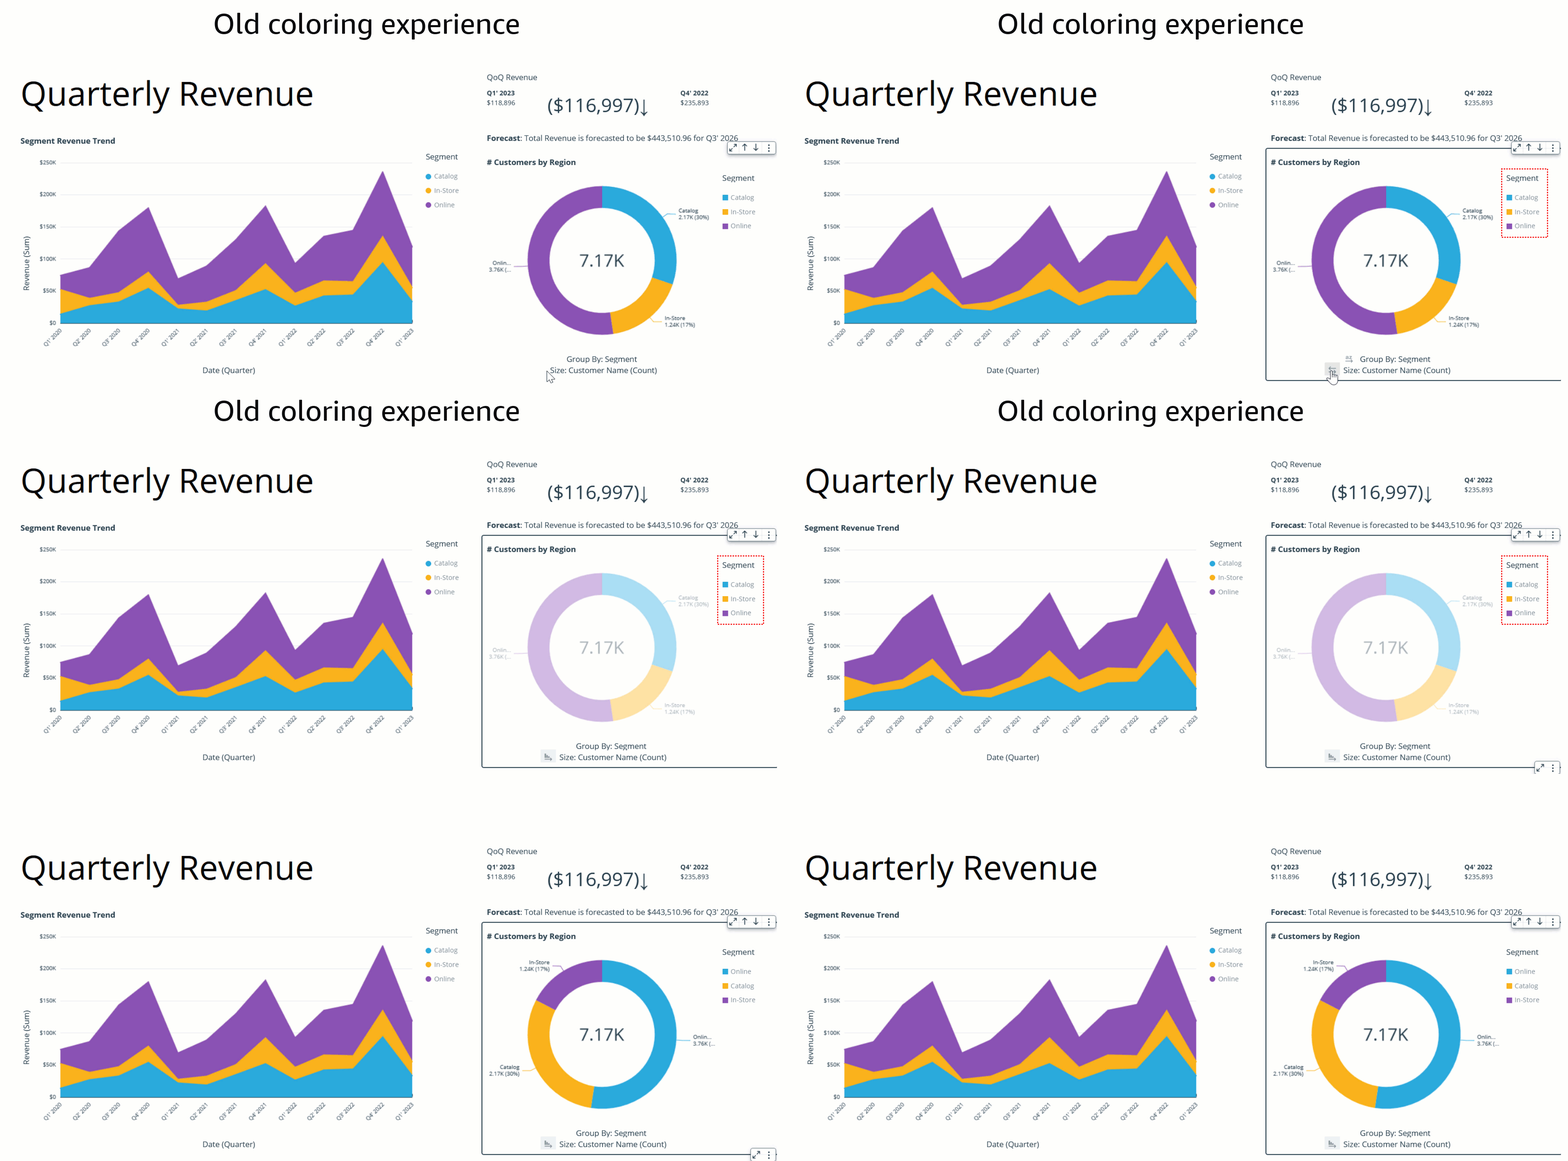
The assigned colors persist and remain unchanged during any visual interaction, such as sorting or filtering, by defining field-based colors. Notice that, after sorting the donut chart another way, the legend order changes, but the colors remain the same.

How to customize field colors
In this section, we demonstrate the various ways you can customize field colors.
Edit field color
There are two ways to add or edit field-based color:
- Fields list pane – Select the field in your analysis and choose Edit field colors from the context menu. This allows you to choose your own colors for each value.
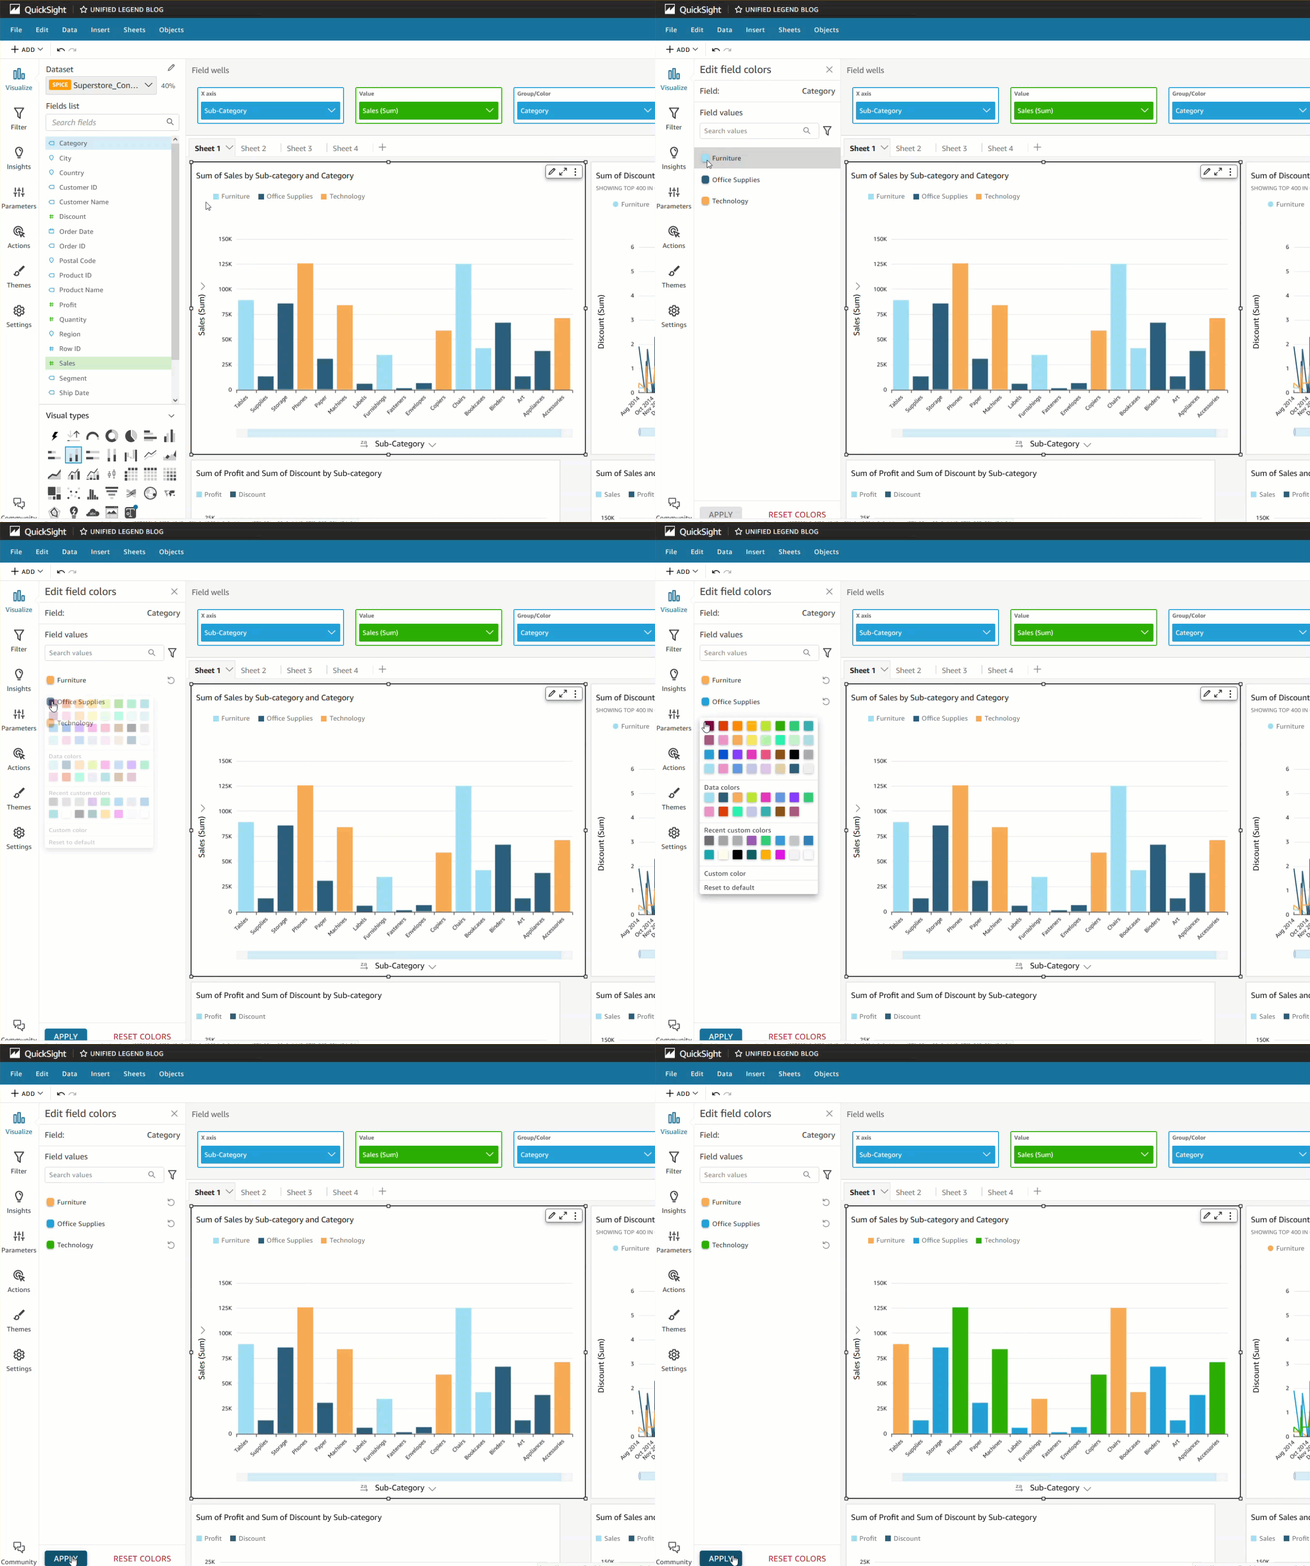
- On-visual menu – To define or modify colors another way, you can simply select the legend or the desired data point. Access the context menu and choose Edit field colors. This opens the Edit field colors pane, which is filtered to display the selected value and allows for easy and convenient color customization.
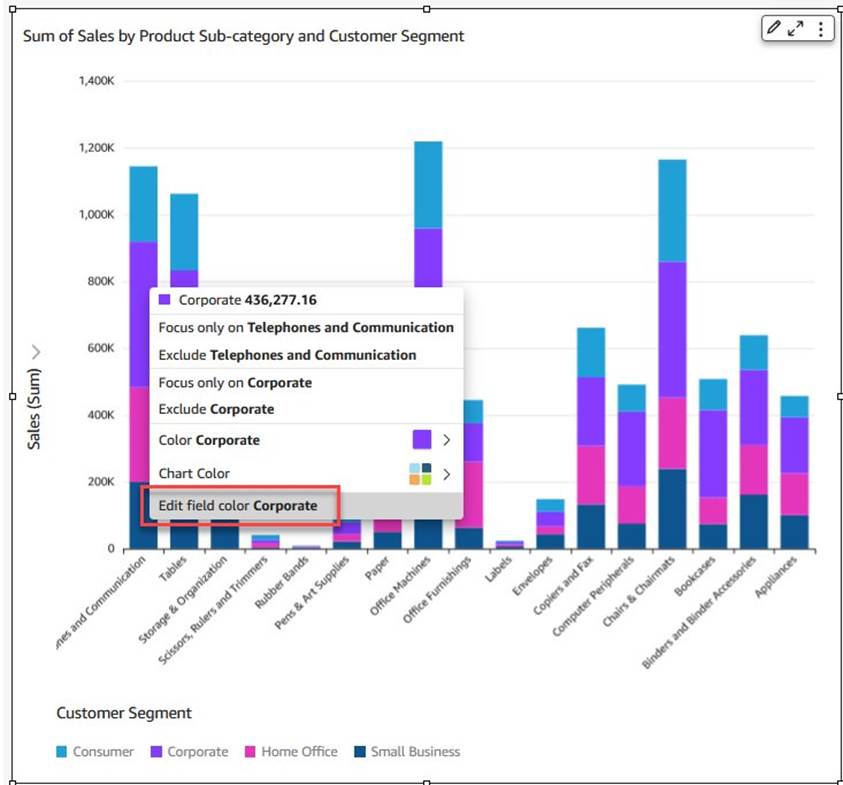
Note the following considerations:
- Colors defined at a visual level override field-based colors.
- You can assign colors to a maximum of 50 values per field. If you want more than 50, you’ll need to reset a previously assigned color to continue.
Reset visual color
If your visuals have colors assigned through the on-visual menu, the field-based colors aren’t visible. This is because on-visual colors take precedence over the field-based color settings. However, you can easily reset the visual-based colors to reveal the underlying field-based colors in such cases.
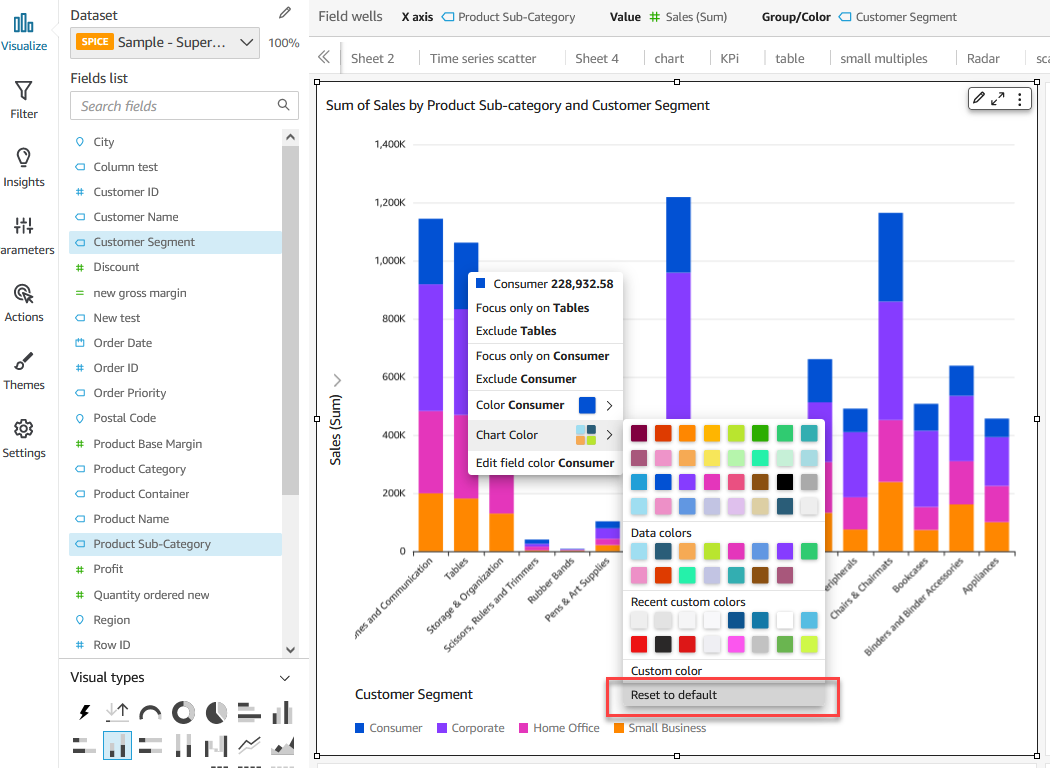
Reset field colors
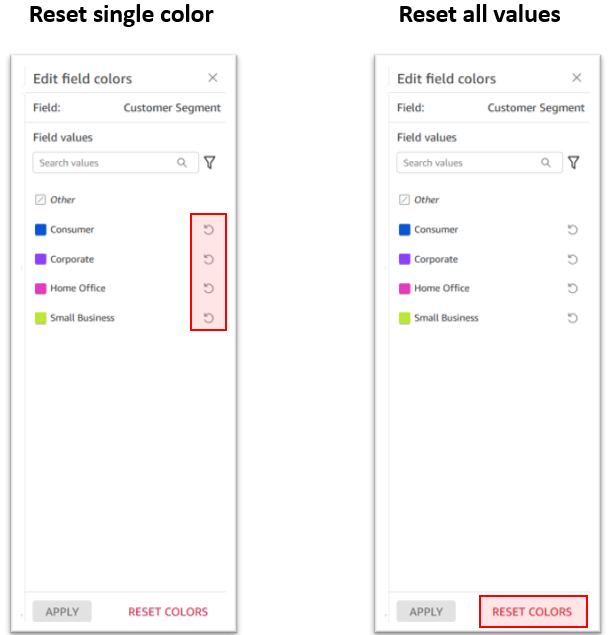
If you want to change the color of a specific value, simply choose the reset icon next to the edited color. Alternatively, if you want to reset all colors, choose Reset colors at the bottom. This restores all edited values to their default color assignment.
Unused color (stale color assignment)
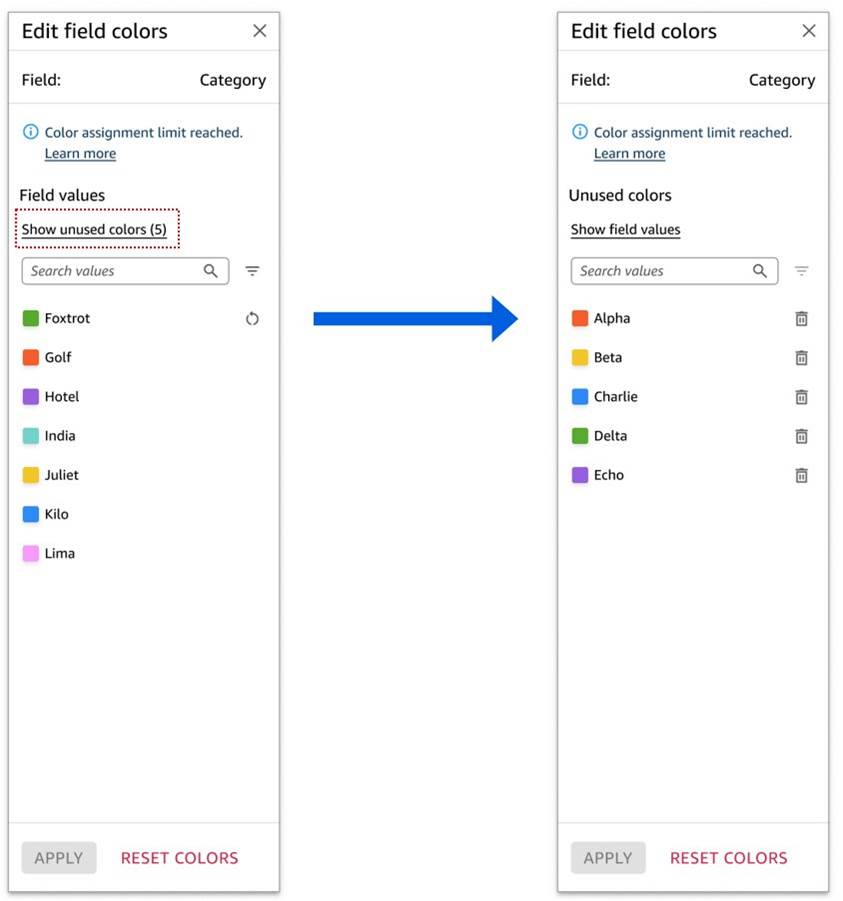
When values that you’ve assigned colors to no longer appear in data, QuickSight labels the values as unused. You can view the unused color assignments and choose to delete them if you’d like.
Conclusion
Field-based coloring options in QuickSight simplify the process of achieving consistent and visually appealing visuals. The persistence of default colors during interactions, such as filtering and sorting, enhances the user experience. Start using field-based coloring today for consistent coloring experience and to enable better comparisons and pattern recognition for effective data interpretation and decision-making.
About the author
 Bhupinder Chadha is a senior product manager for Amazon QuickSight focused on visualization and front end experiences. He is passionate about BI, data visualization and low-code/no-code experiences. Prior to QuickSight he was the lead product manager for Inforiver, responsible for building a enterprise BI product from ground up. Bhupinder started his career in presales, followed by a small gig in consulting and then PM for xViz, an add on visualization product.
- SEO Powered Content & PR Distribution. Get Amplified Today.
- PlatoData.Network Vertical Generative Ai. Empower Yourself. Access Here.
- PlatoAiStream. Web3 Intelligence. Knowledge Amplified. Access Here.
- PlatoESG. Automotive / EVs, Carbon, CleanTech, Energy, Environment, Solar, Waste Management. Access Here.
- BlockOffsets. Modernizing Environmental Offset Ownership. Access Here.
- Source: https://aws.amazon.com/blogs/big-data/introducing-field-based-coloring-experience-for-amazon-quicksight/
- :is
- $UP
- 100
- 1900
- 50
- 610
- a
- ability
- About
- access
- accessible
- achieved
- achieving
- across
- add
- addition
- After
- All
- allows
- also
- Amazon
- Amazon QuickSight
- Amazon Web Services
- an
- analysis
- and
- Announcing
- Another
- any
- appealing
- appear
- approach
- ARE
- AS
- assigned
- At
- attention
- authors
- available
- AWS
- bar
- based
- basis
- BE
- because
- before
- benefits
- BEST
- best practices
- Better
- both
- Bottom
- Building
- but
- by
- CAN
- capability
- captures
- Career
- cases
- caused
- change
- changed
- Changes
- Chart
- Charts
- Choose
- color
- comprehend
- considerations
- consistent
- consulting
- context
- continue
- contrast
- Convenient
- correct
- could
- crucial
- custom
- customization
- customize
- data
- data points
- data visualization
- Decision Making
- Default
- define
- defined
- defining
- demonstrate
- desired
- differ
- different
- Dimension
- Display
- displayed
- distinct
- during
- each
- easily
- easy
- edited
- Effective
- effectively
- either
- enable
- end
- enhance
- Enhances
- enjoy
- ensure
- ensures
- ensuring
- Enterprise
- establish
- Ether (ETH)
- example
- experience
- Experiences
- Feature
- field
- filtering
- focused
- followed
- following
- For
- fresh
- from
- front
- Front end
- gif
- given
- grasp
- Ground
- Have
- he
- his
- However
- HTML
- HTTPS
- ICON
- if
- implementation
- important
- in
- information
- insights
- interaction
- interactions
- interpretation
- introducing
- IT
- jpg
- Key
- Labels
- launch
- lead
- like
- Line
- List
- logic
- longer
- maintain
- manager
- maximum
- meaning
- means
- Menu
- modify
- more
- Need
- next
- no
- Notice..
- now
- of
- on
- opens
- Options
- or
- order
- over
- override
- own
- pane
- passionate
- past
- Pattern
- patterns
- per
- persistence
- plato
- Plato Data Intelligence
- PlatoData
- plays
- Point
- points
- pop
- practices
- present
- previous
- previously
- Prior
- process
- Product
- product manager
- provides
- quickly
- recognition
- remain
- responsible
- restores
- reveal
- Role
- same
- schemes
- Section
- segment
- selected
- senior
- Services
- setting
- settings
- should
- showcase
- Shows
- simplify
- simplifying
- simply
- small
- specific
- start
- started
- stay
- such
- Take
- than
- that
- The
- The Persistence
- their
- Them
- then
- These
- they
- this
- Through
- throughout
- to
- two
- underlying
- unused
- use
- used
- User
- User Experience
- users
- using
- utilize
- value
- Values
- various
- View
- visible
- visualization
- visuals
- want
- was
- Way..
- ways
- we
- web
- web services
- were
- when
- which
- with
- would
- you
- Your
- zephyrnet


