Krones provides breweries, beverage bottlers, and food producers all over the world with individual machines and complete production lines. Every day, millions of glass bottles, cans, and PET containers run through a Krones line. Production lines are complex systems with lots of possible errors that could stall the line and decrease the production yield. Krones wants to detect the failure as early as possible (sometimes even before it happens) and notify production line operators to increase reliability and output. So how to detect a failure? Krones equips their lines with sensors for data collection, which can then be evaluated against rules. Krones, as the line manufacturer, as well as the line operator have the possibility to create monitoring rules for machines. Therefore, beverage bottlers and other operators can define their own margin of error for the line. In the past, Krones used a system based on a time series database. The main challenges were that this system was hard to debug and also queries represented the current state of machines but not the state transitions.
This post shows how Krones built a streaming solution to monitor their lines, based on Amazon Kinesis and Amazon Managed Service for Apache Flink. These fully managed services reduce the complexity of building streaming applications with Apache Flink. Managed Service for Apache Flink manages the underlying Apache Flink components that provide durable application state, metrics, logs, and more, and Kinesis enables you to cost-effectively process streaming data at any scale. If you want to get started with your own Apache Flink application, check out the GitHub repository for samples using the Java, Python, or SQL APIs of Flink.
Overview of solution
Krones’s line monitoring is part of the Krones Shopfloor Guidance system. It provides support in the organization, prioritization, management, and documentation of all activities in the company. It allows them to notify an operator if the machine is stopped or materials are required, regardless where the operator is in the line. Proven condition monitoring rules are already built-in but can also be user defined via the user interface. For example, if a certain data point that is monitored violates a threshold, there can be a text message or trigger for a maintenance order on the line.
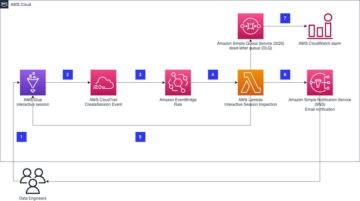
The condition monitoring and rule evaluation system is built on AWS, using AWS analytics services. The following diagram illustrates the architecture.
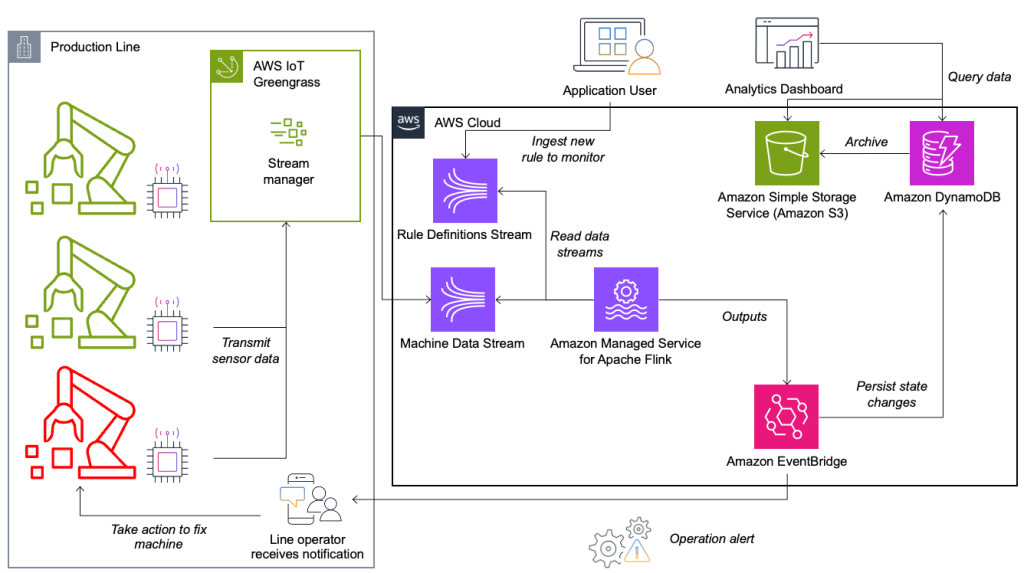
Almost every data streaming application consists of five layers: data source, stream ingestion, stream storage, stream processing, and one or more destinations. In the following sections, we dive deeper into each layer and how the line monitoring solution, built by Krones, works in detail.
Data source
The data is gathered by a service running on an edge device reading several protocols like Siemens S7 or OPC/UA. Raw data is preprocessed to create a unified JSON structure, which makes it easier to process later on in the rule engine. A sample payload converted to JSON might look like the following:
{
  "version": 1,
  "timestamp": 1234,
  "equipmentId": "84068f2f-3f39-4b9c-a995-d2a84d878689",
  "tag": "water_temperature",
  "value": 13.45,
  "quality": "Ok",
  "meta": {
    "sequenceNumber": 123,
    "flags": ["Fst", "Lst", "Wmk", "Syn", "Ats"],
    "createdAt": 12345690,
    "sourceId": "filling_machine"
  }
}
Stream ingestion
AWS IoT Greengrass is an open source Internet of Things (IoT) edge runtime and cloud service. This allows you to act on data locally and aggregate and filter device data. AWS IoT Greengrass provides prebuilt components that can be deployed to the edge. The production line solution uses the stream manager component, which can process data and transfer it to AWS destinations such as AWS IoT Analytics, Amazon Simple Storage Service (Amazon S3), and Kinesis. The stream manager buffers and aggregates records, then sends it to a Kinesis data stream.
Stream storage
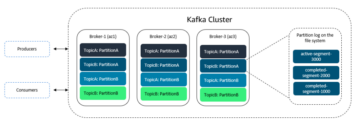
The job of the stream storage is to buffer messages in a fault tolerant way and make it available for consumption to one or more consumer applications. To achieve this on AWS, the most common technologies are Kinesis and Amazon Managed Streaming for Apache Kafka (Amazon MSK). For storing our sensor data from production lines, Krones choose Kinesis. Kinesis is a serverless streaming data service that works at any scale with low latency. Shards within a Kinesis data stream are a uniquely identified sequence of data records, where a stream is composed of one or more shards. Each shard has 2 MB/s of read capacity and 1 MB/s write capacity (with max 1,000 records/s). To avoid hitting those limits, data should be distributed among shards as evenly as possible. Every record that is sent to Kinesis has a partition key, which is used to group data into a shard. Therefore, you want to have a large number of partition keys to distribute the load evenly. The stream manager running on AWS IoT Greengrass supports random partition key assignments, which means that all records end up in a random shard and the load is distributed evenly. A disadvantage of random partition key assignments is that records aren’t stored in order in Kinesis. We explain how to solve this in the next section, where we talk about watermarks.
Watermarks
A watermark is a mechanism used to track and measure the progress of event time in a data stream. The event time is the timestamp from when the event was created at the source. The watermark indicates the timely progress of the stream processing application, so all events with an earlier or equal timestamp are considered as processed. This information is essential for Flink to advance event time and trigger relevant computations, such as window evaluations. The allowed lag between event time and watermark can be configured to determine how long to wait for late data before considering a window complete and advancing the watermark.
Krones has systems all around the globe, and needed to handle late arrivals due to connection losses or other network constraints. They started out by monitoring late arrivals and setting the default Flink late handling to the maximum value they saw in this metric. They experienced issues with time synchronization from the edge devices, which lead them to a more sophisticated way of watermarking. They built a global watermark for all the senders and used the lowest value as the watermark. The timestamps are stored in a HashMap for all incoming events. When the watermarks are emitted periodically, the smallest value of this HashMap is used. To avoid stalling of watermarks by missing data, they configured an idleTimeOut parameter, which ignores timestamps that are older than a certain threshold. This increases latency but gives strong data consistency.
public class BucketWatermarkGenerator implements WatermarkGenerator<DataPointEvent> {
private HashMap <String, WatermarkAndTimestamp> lastTimestamps;
private Long idleTimeOut;
private long maxOutOfOrderness;
}
Stream processing
After the data is collected from sensors and ingested into Kinesis, it needs to be evaluated by a rule engine. A rule in this system represents the state of a single metric (such as temperature) or a collection of metrics. To interpret a metric, more than one data point is used, which is a stateful calculation. In this section, we dive deeper into the keyed state and broadcast state in Apache Flink and how they’re used to build the Krones rule engine.
Control stream and broadcast state pattern
In Apache Flink, state refers to the ability of the system to store and manage information persistently across time and operations, enabling the processing of streaming data with support for stateful computations.
The broadcast state pattern allows the distribution of a state to all parallel instances of an operator. Therefore, all operators have the same state and data can be processed using this same state. This read-only data can be ingested by using a control stream. A control stream is a regular data stream, but usually with a much lower data rate. This pattern allows you to dynamically update the state on all operators, enabling the user to change the state and behavior of the application without the need for a redeploy. More precisely, the distribution of the state is done by the use of a control stream. By adding a new record into the control stream, all operators receive this update and are using the new state for the processing of new messages.
This allows users of Krones application to ingest new rules into the Flink application without restarting it. This avoids downtime and gives a great user experience as changes happen in real time. A rule covers a scenario in order to detect a process deviation. Sometimes, the machine data is not as easy to interpret as it might look at first glance. If a temperature sensor is sending high values, this might indicate an error, but also be the effect of an ongoing maintenance procedure. It’s important to put metrics in context and filter some values. This is achieved by a concept called grouping.
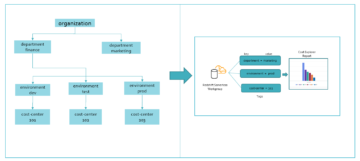
Grouping of metrics
The grouping of data and metrics allows you to define the relevance of incoming data and produce accurate results. Let’s walk through the example in the following figure.
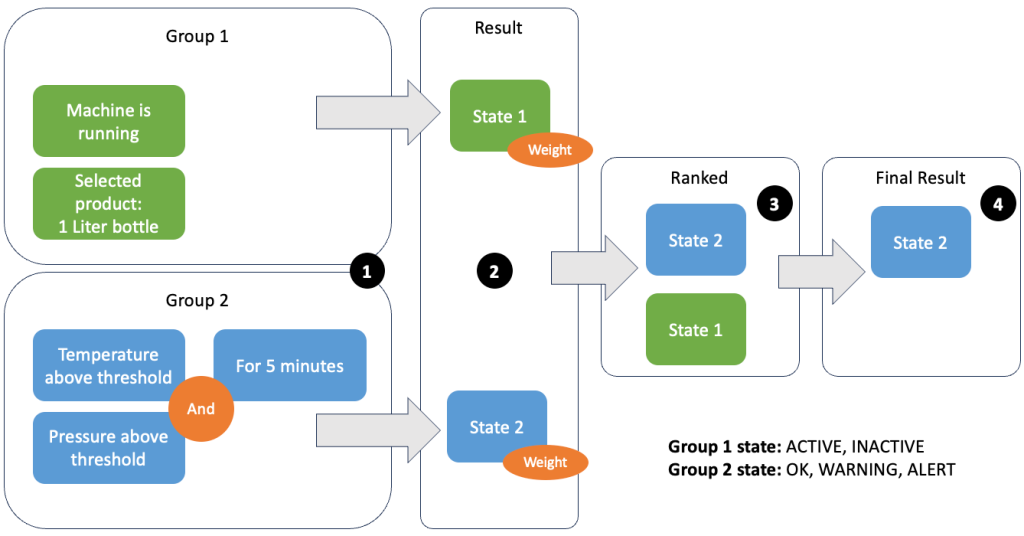
In Step 1, we define two condition groups. Group 1 collects the machine state and which product is going through the line. Group 2 uses the value of the temperature and pressure sensors. A condition group can have different states depending on the values it receives. In this example, group 1 receives data that the machine is running, and the one-liter bottle is selected as the product; this gives this group the state ACTIVE. Group 2 has metrics for temperature and pressure; both metrics are above their thresholds for more than 5 minutes. This results in group 2 being in a WARNING state. This means group 1 reports that everything is fine and group 2 does not. In Step 2, weights are added to the groups. This is needed in some situations, because groups might report conflicting information. In this scenario, group 1 reports ACTIVE and group 2 reports WARNING, so it’s not clear to the system what the state of the line is. After adding the weights, the states can be ranked, as shown in step 3. Lastly, the highest ranked state is chosen as the winning one, as shown in Step 4.
After the rules are evaluated and the final machine state is defined, the results will be further processed. The action taken depends on the rule configuration; this can be a notification to the line operator to restock materials, do some maintenance, or just a visual update on the dashboard. This part of the system, which evaluates metrics and rules and takes actions based on the results, is referred to as a rule engine.
Scaling the rule engine
By letting users build their own rules, the rule engine can have a high number of rules that it needs to evaluate, and some rules might use the same sensor data as other rules. Flink is a distributed system that scales very well horizontally. To distribute a data stream to several tasks, you can use the keyBy() method. This allows you to partition a data stream in a logical way and send parts of the data to different task managers. This is often done by choosing an arbitrary key so you get an evenly distributed load. In this case, Krones added a ruleId to the data point and used it as a key. Otherwise, data points that are needed are processed by another task. The keyed data stream can be used across all rules just like a regular variable.
Destinations
When a rule changes its state, the information is sent to a Kinesis stream and then via Amazon EventBridge to consumers. One of the consumers creates a notification from the event that is transmitted to the production line and alerts the personnel to act. To be able to analyze the rule state changes, another service writes the data to an Amazon DynamoDB table for fast access and a TTL is in place to offload long-term history to Amazon S3 for further reporting.
Conclusion
In this post, we showed you how Krones built a real-time production line monitoring system on AWS. Managed Service for Apache Flink allowed the Krones team to get started quickly by focusing on application development rather than infrastructure. The real-time capabilities of Flink enabled Krones to reduce machine downtime by 10% and increase efficiency up to 5%.
If you want to build your own streaming applications, check out the available samples on the GitHub repository. If you want to extend your Flink application with custom connectors, see Making it Easier to Build Connectors with Apache Flink: Introducing the Async Sink. The Async Sink is available in Apache Flink version 1.15.1 and later.
About the Authors
 Florian Mair is a Senior Solutions Architect and data streaming expert at AWS. He is a technologist that helps customers in Europe succeed and innovate by solving business challenges using AWS Cloud services. Besides working as a Solutions Architect, Florian is a passionate mountaineer, and has climbed some of the highest mountains across Europe.
 Emil Dietl is a Senior Tech Lead at Krones specializing in data engineering, with a key field in Apache Flink and microservices. His work often involves the development and maintenance of mission-critical software. Outside of his professional life, he deeply values spending quality time with his family.
 Simon Peyer is a Solutions Architect at AWS based in Switzerland. He is a practical doer and is passionate about connecting technology and people using AWS Cloud services. A special focus for him is data streaming and automations. Besides work, Simon enjoys his family, the outdoors, and hiking in the mountains.
- SEO Powered Content & PR Distribution. Get Amplified Today.
- PlatoData.Network Vertical Generative Ai. Empower Yourself. Access Here.
- PlatoAiStream. Web3 Intelligence. Knowledge Amplified. Access Here.
- PlatoESG. Carbon, CleanTech, Energy, Environment, Solar, Waste Management. Access Here.
- PlatoHealth. Biotech and Clinical Trials Intelligence. Access Here.
- Source: https://aws.amazon.com/blogs/big-data/krones-real-time-production-line-monitoring-with-amazon-managed-service-for-apache-flink/
- :has
- :is
- :not
- :where
- $UP
- 000
- 1
- 100
- 125
- 13
- 15%
- 2%
- 4
- 45
- 5
- a
- ability
- Able
- About
- above
- access
- accurate
- Achieve
- achieved
- across
- Act
- Action
- actions
- activities
- added
- adding
- advance
- advancing
- After
- against
- aggregate
- aggregates
- Alerts
- All
- allowed
- allows
- already
- also
- Amazon
- Amazon Web Services
- among
- an
- analytics
- analyze
- and
- Another
- any
- Apache
- APIs
- Application
- Application Development
- applications
- arbitrary
- architecture
- ARE
- around
- AS
- assignments
- At
- ATS
- available
- avoid
- avoids
- AWS
- AWS IoT Greengrass
- based
- BE
- because
- before
- behavior
- being
- besides
- between
- BEVERAGE
- both
- broadcast
- buffer
- build
- Building
- built
- built-in
- business
- but
- by
- calculation
- called
- CAN
- capabilities
- Capacity
- case
- certain
- challenges
- change
- Changes
- check
- Choose
- choosing
- chosen
- class
- clear
- Climbed
- Cloud
- cloud services
- collected
- collection
- collects
- Common
- company
- complete
- complex
- complexity
- component
- components
- composed
- computations
- concept
- condition
- Configuration
- configured
- Conflicting
- Connecting
- connection
- connectors
- considered
- considering
- consistency
- consists
- constraints
- consumer
- Consumers
- consumption
- Containers
- context
- control
- converted
- could
- covers
- create
- created
- creates
- Current
- Current state
- custom
- Customers
- dashboard
- data
- data points
- Database
- day
- decrease
- deeper
- deeply
- Default
- define
- defined
- Depending
- depends
- deployed
- destinations
- detail
- detect
- Determine
- Development
- deviation
- device
- Devices
- diagram
- different
- Disadvantage
- distribute
- distributed
- distribution
- dive
- do
- documentation
- does
- done
- downtime
- due
- dynamically
- each
- Earlier
- Early
- easier
- easy
- Edge
- effect
- efficiency
- enabled
- enables
- enabling
- end
- Engine
- Engineering
- equal
- error
- Errors
- essential
- Ether (ETH)
- Europe
- evaluate
- evaluated
- evaluation
- evaluations
- Even
- evenly
- Event
- events
- Every
- every day
- everything
- example
- experience
- experienced
- expert
- Explain
- extend
- Failure
- family
- FAST
- fault
- field
- Figure
- filter
- final
- fine
- First
- five
- flags
- Focus
- focusing
- following
- food
- For
- from
- fully
- further
- gathered
- get
- gives
- Glance
- glass
- Global
- globe
- going
- great
- Group
- Group’s
- handle
- Handling
- happen
- happens
- Hard
- Have
- he
- helps
- High
- highest
- hiking
- him
- his
- history
- hitting
- How
- How To
- HTTPS
- identified
- if
- illustrates
- implements
- important
- in
- Incoming
- Increase
- Increases
- indicate
- indicates
- individual
- information
- Infrastructure
- innovate
- instances
- Interface
- Internet
- internet of things
- into
- introducing
- involves
- iot
- issues
- IT
- ITS
- Java
- Job
- jpg
- json
- just
- Key
- keys
- large
- lastly
- Late
- Latency
- later
- layer
- layers
- lead
- letting
- Life
- like
- limits
- Line
- lines
- load
- locally
- logical
- Long
- long-term
- Look
- look like
- losses
- lots
- Low
- lower
- lowest
- machine
- Machines
- Main
- maintenance
- make
- MAKES
- manage
- managed
- management
- manager
- Managers
- manages
- Manufacturer
- Margin
- materials
- max
- maximum
- means
- measure
- mechanism
- message
- messages
- Meta
- method
- metric
- Metrics
- microservices
- might
- millions
- minutes
- missing
- Monitor
- monitored
- monitoring
- more
- most
- much
- Need
- needed
- needs
- network
- New
- next
- notification
- number
- of
- often
- older
- on
- ONE
- ongoing
- open
- open source
- Operations
- operator
- operators
- or
- order
- organization
- Other
- otherwise
- our
- out
- outdoors
- output
- outside
- over
- own
- Parallel
- parameter
- part
- parts
- passionate
- past
- Pattern
- People
- persistently
- Personnel
- pet
- PHP
- Place
- plato
- Plato Data Intelligence
- PlatoData
- Point
- points
- possibility
- possible
- Post
- Practical
- precisely
- pressure
- prioritization
- private
- procedure
- process
- processed
- processing
- produce
- Producers
- Product
- Production
- professional
- Progress
- protocols
- proven
- provide
- provides
- put
- Python
- quality
- queries
- quickly
- random
- ranked
- Rate
- rather
- Raw
- raw data
- Read
- Reading
- real
- real-time
- receive
- receives
- record
- records
- reduce
- referred
- refers
- Regardless
- regular
- relevance
- relevant
- reliability
- report
- Reporting
- Reports
- represented
- represents
- required
- Results
- Rule
- rules
- Run
- running
- runtime
- same
- sample
- saw
- Scale
- scales
- scenario
- Section
- sections
- see
- selected
- send
- sending
- sends
- senior
- sensors
- sent
- Sequence
- Series
- Serverless
- service
- Services
- setting
- several
- should
- showed
- shown
- Shows
- Siemens
- Simon
- Simple
- single
- situations
- smallest
- So
- Software
- solution
- Solutions
- SOLVE
- Solving
- some
- sometimes
- sophisticated
- Source
- special
- specializing
- Spending
- SQL
- stalling
- started
- State
- States
- Step
- stopped
- storage
- store
- stored
- storing
- stream
- streaming
- String
- strong
- structure
- succeed
- such
- support
- Supports
- switzerland
- SYN
- synchronization
- system
- Systems
- table
- TAG
- taken
- takes
- Talk
- Task
- tasks
- team
- tech
- Technologies
- technologist
- Technology
- text
- than
- that
- The
- the information
- The Source
- The State
- the world
- their
- Them
- then
- There.
- therefore
- These
- they
- things
- this
- those
- threshold
- Through
- time
- Time Series
- timely
- timestamp
- to
- track
- transfer
- transitions
- trigger
- two
- underlying
- unified
- uniquely
- Update
- use
- used
- User
- User Experience
- User Interface
- users
- uses
- using
- usually
- value
- Values
- variable
- version
- very
- via
- visual
- wait
- walk
- want
- wants
- was
- watermark
- watermarking
- watermarks
- Way..
- we
- web
- web services
- WELL
- were
- What
- when
- which
- will
- window
- winning
- with
- within
- without
- Work
- working
- works
- world
- write
- Yield
- you
- Your
- zephyrnet