Kusama is surging once again but Polakdot also advanced to a crucial resistance area and might be just able to catch up so let’s have a closer look at today’s latest altcoin news.
Kusama looks like it is approaching a new top after surging over 13% in the past 12 hours but DOT rose by 4.4% in the same period it has to cut up the critical resistance but KSM looks poised to retrace and DOT might gain further bullish momentum. The canary network for the Polkadot blockchain, Kusama enjoyed a rally in the market and the technical point to the brief correction might allow DOT to take the lead.
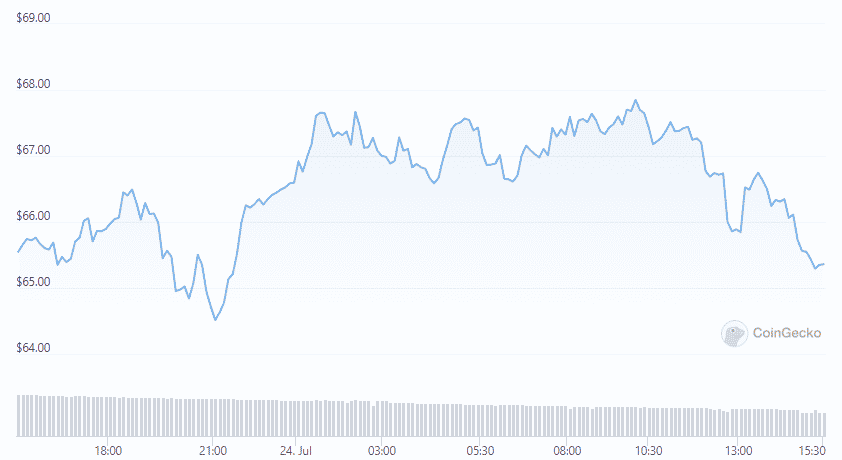
Kusama is surging and outperformed Poladkot in the latest market bounce but the near-term outlook for both these assets is different. Kusama surged by 13% in the past 12 hours as the crypto market enjoys a new tailwind. The Polkadot canary network surged from a low of $61 to a local high of $69 so despite the upward price action, KSM looks poised for a surge in profit taking. The Tom DeMark Seqnetual Indicators presented a new selling signal on the Kusama daily chart. The bearish formation developed after KSM met its 32% upside target of a descending triangle that was forecasted.
The increase in selling pressure can help validate this pessimistic outlook and lead to a correction to $61 and $57. Kusama will need to meet the daily candlestick above $68 to have a chance at invalidating the bearish thesis and if it succeeds, the critical areas of the resistance to watch are between $73 and $81. While Kusama looks like it will be near a local top, Polkadot seems to have more room to increase. DOT increased 4.4% in the past 12 hours which helped it move the 50-day moving average to $7.60 on the daily charts.
ADVERTISEMENT
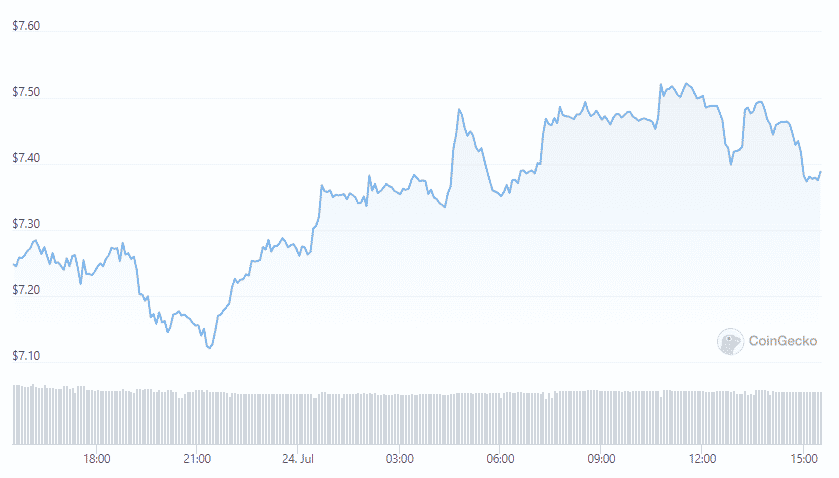
Given that Polkadot broke out of the descending parallel channel and had a good chance of making another 20% surge towards $9.40. DOT needs to breach the 50-day moving average and surpassed the $8 resistance level to get there and if it fails to do so, it can suffer a steep correction to $6.80.
ADVERTISEMENT
DC Forecasts is a leader in many crypto news categories, striving for the highest journalistic standards and abiding by a strict set of editorial policies. If you are interested to offer your expertise or contribute to our news website, feel free to contact us at [email protected]
- Altcoin News
- Bitcoin
- blockchain
- blockchain compliance
- blockchain conference
- coinbase
- coingenius
- Consensus
- crypto conference
- crypto mining
- cryptocurrency
- DC Forecasts
- decentralized
- DeFi
- Digital Assets
- dot price
- ethereum
- KSM
- ksm price
- ksm token
- Kusama
- kusama is surging
- kusama price
- machine learning
- non fungible token
- plato
- plato ai
- Plato Data Intelligence
- Platoblockchain
- PlatoData
- platogaming
- polkadot price
- Polygon
- proof of stake
- W3
- zephyrnet