TL;DR Breakdown
- Litecoin price analysis reveals that LTC has recovered to the $182 level after the crash.
- The flash crash swept the market following the king Bitcoin.
- Current support is found at the $173 mark.
- Current resistance is found at the $188 mark.
Litecoin price analysis reveals that the cryptocurrency is coming out of the flash crash movement rather strongly. The cryptocurrency fell almost $34 with the flash crash from the $200 range to the $164.84 mark. Litecoin price is down by 16.60 percent in the past 24-hours; however, the cryptocurrency is up by 5.62 percent in the past seven days. The cryptocurrency stands at the 12th spot when it comes to overall market capitalization. The current movement is driven by Bitcoin’s flash crash, and the market is suffering the king’s tide as usual.
Litecoin price analysis: 1-day candlestick shows bearish crossovers
The one-day candlestick Litecoin price analysis chart shows a few bearish crossovers happening at the time of writing owing to the flash crash momentum that has developed in the past 24-hours. The upper Bollinger band is found at the $221 mark, also marking the strongest resistance point; with the volatility increasing many folds, the lower Bollinger band is found at the $150.77 mark, also marking the strongest support point.

The nine-day moving average and the Bollinger bands’ average are marking bearish crossovers above the current price level. The nine-day moving average is found at the $197 mark, well above the current price. Whereas the Bollinger bands’ average is found at the $186 mark, slightly above the current price found at the $182.86 mark at the time of writing. The relative strength index is found at the neutral score of 50.07, giving ample opportunity to the buyers to make the shape of the upcoming momentum.
LTC/USD 4 hour chart shows more bearish than bullish indications
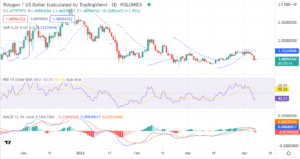
The four-hour candlestick Litecoin price analysis chart also shows more bearish signals than bullish momentum. The volatility has increased many folds compared to the past 24 hours, while the volatility is at a similar level as it was in the past few days for the Litecoin price movement. The upper Bollinger band is found at the $247 mark, also marking the strongest resistance. While the lower Bollinger band is found at the $172.76 mark, also marking the strongest support on the charts.

The Bollinger bands’ average and the nine-day moving average are marking bearish crossovers on the chart. The Bollinger bands’ average is found at the $210 mark, showing the first bearish crossover. The nine-day moving average is found at $195, showing the second bearish crossover. Litecoin’s price is hovering between $180 and $182 at the time of writing. The relative strength index (RSI) score has improved slightly from the oversold zone to the value of 30.99, showing the still oversold status of the cryptocurrency, which is also a bearish signal.
Litecoin price analysis conclusion
Litecoin price analysis charts reveal that the cryptocurrency is following the overall market movement into a bearish tide. If the current support level persists, the altcoin is likely to make it a base to retest the higher levels found at $185 and above that at $188. If the current support falters, the altcoin is likely to take a dip below the $180 range and possibly down to the $173 strong support levels.
Disclaimer. The information provided is not trading advice. Cryptopolitan.com holds no liability for any investments made based on the information provided on this page. We strongly recommend independent research and/or consultation with a qualified professional before making any investment decisions.
Source: https://api.follow.it/track-rss-story-click/v3/tHfgumto13COKffnPRp3m8qq6eZJzUh9
- 77
- 84
- advice
- Altcoin
- analysis
- bearish
- Bitcoin
- Bullish
- capitalization
- Charts
- coming
- Crash
- cryptocurrency
- Current
- data
- driven
- First
- Flash
- Giving
- HTTPS
- index
- information
- investment
- Investments
- IT
- King
- Level
- liability
- Litecoin
- Litecoin price
- LTC
- Making
- mark
- Market
- Market Capitalization
- Momentum
- Opportunity
- price
- Price Analysis
- range
- research
- Spot
- Status
- support
- support level
- Tide
- time
- Trading
- value
- Volatility
- writing