![]()
TL;DR Breakdown
- Litecoin price analysis suggests retracement to the $210 mark
- The closest support level lies at $220
- LTC faces resistance at the $230 mark
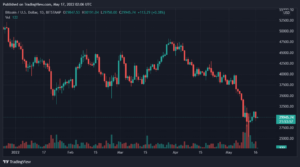
The Litecoin price analysis shows that the spike in Litecoin’s price has left the price action unstable at the $230 mark. While the market continues to observe a positive sentiment, the bulls show exhaustion suggesting a retracement before the rally continues towards the $250 mark.
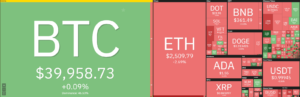
The broader cryptocurrency market observes a mixed market sentiment as while most major cryptocurrencies record positive price movements, the movements have been small while many assets, including Ethereum, record losses. Major players include Filecoin and Ripple’s XRP, recording an 11.88 and a 6.80 percent incline, respectively.
Litecoin price analysis: exhausted bulls
Across the technical indicators, the MACD is bullish, as expressed by the green histogram. However, the indicator has been showing a declining bullish momentum for the last 48 hours as the price action slowed after the spike from the $185 to the $215 mark. Nonetheless, the indicator remains bullish as LTC continued to rise until the recent rejection at the $230 mark.
The EMAs are both moving upwards at press time, with the 12-EMA moving with a gentler slope as the price faces resistance at the $230.00 mark. The convergence suggests low buying pressure at the current time as the bears struggle for dominance.
The RSI is currently hovering at the edge of the neutral zone, rising to the overbought region issuing a sell signal. The indicator’s high position leaves little room for further upwards movement in the Litecoin price analysis. Overall, the RSI indicates towards downwards movement towards the $210 mark.
The Bollinger Bands are currently wide, showing high volatility for the Litecoin price. However, the bands have started to converge as the price stabilizes above the $220 mark. Currently, the indicator is not issuing any signal but suggests a dropping price volatility for LTC in the short term.
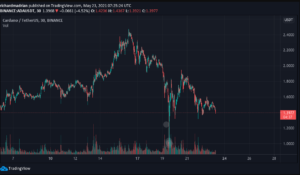
Technical analysis for ADA/USDT
Overall, the 4-hour Litecoin price analysis issues a buy signal showing bullish momentum in the markets as 15 of the 26 major indicators suggests a downwards movement for the Chainlink price. On the other hand, only three of the indicators suggest downwards movement showing a low bearish presence at the current price level. Meanwhile, the remaining eight indicators are neutral and do not support either side of the market.
The 24-hour Litecoin price analysis shares this sentiment as the analysis shows 14 indicators supporting the bulls against only five indicators suggesting bearish dominance. At the same time, seven indicators are sitting on the fence at the time of writing. The shared positive sentiment between the two indicators shows strong bullish dominance over the LINK price action.
What to expect from the Litecoin price analysis?
The Litecoin price analysis suggests dropping volatility for LTC across the short-term charts. While the mid-term analysis remains bullish, supporting the buyers, the short-term indicators show bullish exhaustion and suggest the sharp movement has left LTC/USDT unstable at the $230 mark.
As such, the traders should expect a retracement to the $210 mark as the selling pressure escalates. Further below the next support level lies at the $200 mark. However, the bullish sentiment in the markets suggests a swift bounce back to the $230 mark.
Disclaimer. The information provided is not trading advice. Cryptopolitan.com holds no liability for any investments made based on the information provided on this page. We strongly recommend independent research and/or consultation with a qualified professional before making any investment decisions.
Source: https://api.follow.it/track-rss-story-click/v3/tHfgumto13A_qEB85hi2pNKEpFgimKzx
- 11
- Action
- advice
- analysis
- Assets
- bearish
- Bears
- Bullish
- Bulls
- buy
- Buying
- Chainlink
- Charts
- continues
- crypto
- cryptocurrencies
- cryptocurrency
- cryptocurrency market
- Current
- Edge
- ethereum
- faces
- follow
- Green
- High
- HTTPS
- Including
- information
- investment
- Investments
- issues
- Level
- liability
- LINK
- Litecoin
- Litecoin price
- LTC
- major
- Making
- mark
- Market
- Markets
- mixed
- Momentum
- Other
- press
- pressure
- price
- Price Analysis
- rally
- research
- sell
- sentiment
- shared
- Shares
- Short
- small
- started
- support
- support level
- SWIFT
- Technical
- time
- Traders
- Trading
- Volatility
- writing
- xrp