Is it still a good time to enter Litecoin (LTC)? On-chain metrics from intotheblock.com for Litecoin (LTC) and at press time show that 92% of holders are making money at the current price with about 49% concentration of large holders. The Litecoin network also maintains a tokeninsight rating of “BBB”, which considers the network as stable at 98.1697%.
Although there’s a close correlation with Bitcoin at 0.84, the LTCBTC price chart below shows an increase in demand for LTC against Bitcoin at the time of this report.
Let’s analyze the demand and supply scenario for LTC on the LTCBTC and LTCUSDT price charts.
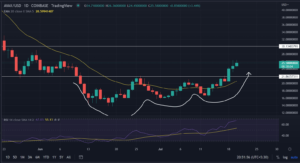
Litecoin Price Prediction: LTCBTC Monthly Charts

Pairing the LTC against BTC, the above chart reveals a regular bullish divergence from a monthly scale which also corresponds with a similar bullish divergence on the weekly time, both happening simultaneously, and indicates massive demand for Litecoin against Bitcoin into the coming weeks.
Read on as we uncover the significant chart patterns and price levels driving the LTCUSDT crypto pair.
Litecoin Price Prediction: LTCUSDT Weekly Charts
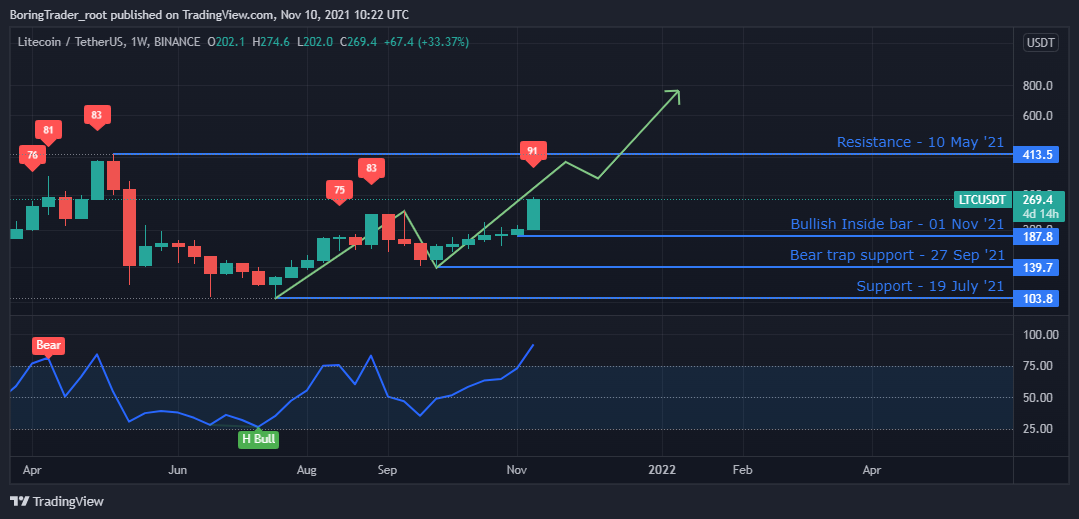
A hidden bullish divergence formation fixed the LTCUSDT support at $103.80 on 19 July ’21 before transferring control to the bulls for about a 120% price hike before making another correction.
The 27 September ’21 bear trap pattern fixed higher support [$129.70] price above the $103.80 price floor followed by a series of hidden inside bar candlestick patterns that lasted for another five weeks before the price surge presently at play.
Litecoin Price Prediction: LTCUSDT Daily Charts

The Litecoin vs. USDT from the daily time frame resumed the uptrend after a regular bullish divergence on 28 September ’21 and sustained the uptrend by flagging a hidden bullish divergence on 27 October ’21 while the RSI prints higher values above level-25.
We expect to scale into the current uptrend after a price pull-back which will be visible with RSI values hovering between level-25 and level-75 on the daily time frame, or drop below level-25 on the 4HR time frame.
Let’s move a step lower to the 4HR time frame.
Litecoin Price Prediction: LTCUSDT 4 Hr Charts
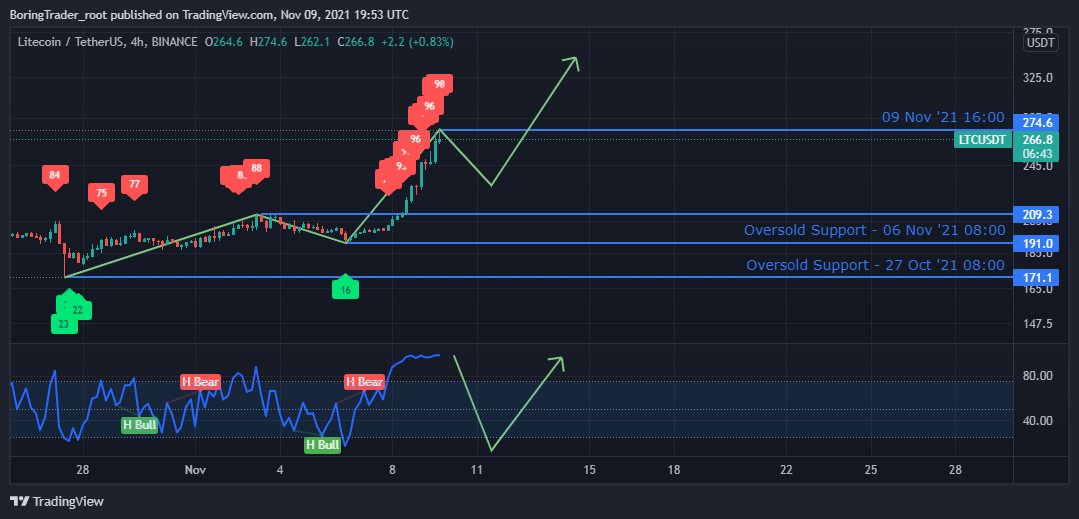
Oversold levels on the 4hR time frame have proved to be good estimates of the higher RSI values above level-25 on the daily time frame as shown on the above chart, specifically 27 October 08:00 and 06 November 08:00.
However, considering the recent high volatility which can be seen with the RSI printing consecutive higher values above level-75, it is safe to say that the coming entry signals will be triggered by oversold levels on the 1HR time frame, and not forgetting to place a stop-loss order at a safe distance below the entry-level.
The current bullish outlook across multiple time frames on the LTCUSDT crypto pair could last all through Q4 ’21 since the LTC also sees higher demand against Bitcoin BTC, the number one crypto asset.
- 84
- 98
- All
- asset
- Bitcoin
- Bitcoin BTC
- BTC
- Bull Run
- Bullish
- Bulls
- Charts
- coming
- concentration
- considers
- content
- crypto
- crypto asset
- cryptocurrencies
- Current
- Demand
- distance
- driving
- Drop
- estimates
- financial
- good
- here
- High
- hold
- hr
- HTTPS
- Increase
- intotheblock
- investing
- IT
- July
- large
- Litecoin
- Litecoin (LTC)
- Litecoin price
- LTC
- Making
- Market
- market research
- Metrics
- money
- move
- network
- Opinion
- order
- Outlook
- Pattern
- Play
- prediction
- press
- price
- Price Prediction
- price surge
- report
- research
- Run
- safe
- Scale
- sees
- Series
- Share
- supply
- support
- surge
- time
- uncover
- USDT
- Volatility
- Watch
- weekly