Litecoin Price Prediction – November 18
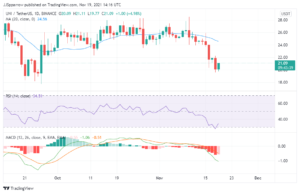
As the daily chart shows, the Litecoin price keeps dropping below the moving averages following the current bearish action in the market.
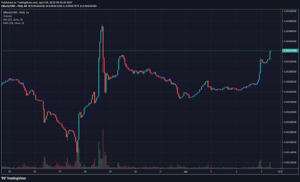
LTC/USD Market
Key Levels:
Resistance levels: $255, $265, $275
Support levels: $165, $155, $145

The daily chart reveals that LTC/USD has been recording some losses since the last few days. LTC/USD begins to follow the bearish trend at the time of writing as the cryptocurrency focus on the downtrend. At the moment, the Litecoin price is currently trading below the 9-day and 21-day moving averages as the price heads toward the lower boundary of the channel.
Litecoin Price Prediction: Litecoin (LTC) Ready to Break More Downs
The Litecoin price is likely to break more downtrends as the coin fails to recover from the current trading levels. Therefore, the more likely it falls, the more the traders may see the cryptocurrency fall to a new trading low. A break below the $200 support level may provoke an even deeper decline towards below the lower boundary of the channel. The short-term technical analysis reveals that the coin is likely to locate the supports at $165, $155, and $145 if broken below the channel.
Looking at the daily chart, a break above the 9-day moving average may propel the Litecoin price to move towards the nearest resistance level of $250 while a further push could take it to a high of $255, $265, and $275 resistance levels. As it stands now, the technical indicator Relative Strength Index (14) keeps breaking more downs, crossing below 45-level could cause the market to experience another deep fall.

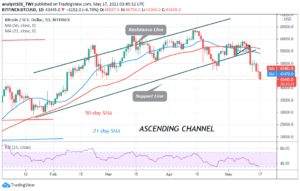
Comparing with BTC, Litecoin (LTC) is still experiencing another downtrend within the channel, especially in the past few days. The coin recently breaks under solid support at 4000 SAT and continues to fall through subsequent support level to 3500 SAT. The critical support level is located at the 3200 SAT and below.

However, if the bulls manage to power the market, traders may likely find the resistance level at 4000 SAT and above. Meanwhile, the Litecoin price is currently changing hands at 3602 SAT but a surge in volatility may occur as the technical indicator Relative Strength Index (14) may cross below 50-level, which suggests that more bearish signals may play out.
Looking to buy or trade Litecoin (LTC) now? Invest at eToro!
68% of retail investor accounts lose money when trading CFDs with this provider
- "
- Action
- All
- analysis
- bearish
- BTC
- Bulls
- buy
- Cause
- Coin
- continues
- cryptocurrency
- Current
- experience
- Focus
- follow
- High
- HTTPS
- index
- investor
- IT
- Level
- Litecoin
- Litecoin (LTC)
- Litecoin price
- LTC
- LTC/USD
- Market
- money
- move
- Play
- power
- prediction
- price
- Price Prediction
- Recover
- retail
- support
- support level
- Supports
- surge
- Technical
- Technical Analysis
- time
- trade
- Traders
- Trading
- Volatility
- within
- writing