Litecoin Price Prediction – September 19
The Litecoin price prediction moves below the moving averages within the channel as the technical indicator reveals the next direction.
LTC/USD Market
Key Levels:
Resistance levels: $205, $215, $225
Support levels: $150, $140, $130

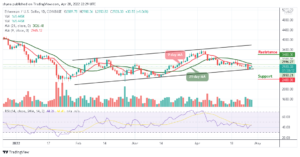
LTC/USD is recording some losses at the time of writing this as the price is now hovering around $177.75 where it could stay below the 9-day and 21-day moving averages. After the opening of today’s trading at $181, the Litecoin price moves to touch the daily low of $175 support. Looking at the daily chart, it seems the Litecoin price may be heading back towards the immediate support level of $170 below the moving averages.
Litecoin Price Prediction: Litecoin Price May Retest $160 Support
As the coin moves within the channel, in as much as the Litecoin price fails to drop from the current trading level, the traders may see the cryptocurrency falling to another trading low and a cross below the lower boundary of the channel may provoke a dip decline towards the support levels of $150, $140, and $130 levels respectively. Meanwhile, the short-term technical analysis shows that the $175 and $170 levels are currently the strongest forms of technical support.
However, a break above the 21-day moving average may cause the Litecoin price to move towards the nearest resistance level of $200. Therefore, a further bullish push could take LTC/USD to the resistance levels of $205, $215, and $225. On the contrary, the Relative Strength Index (14) is currently facing the south as the signal line moves below 50-level which may cause the market to experience more downtrends.

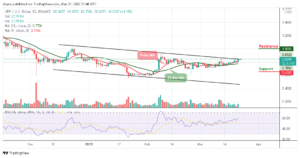
When compares with Bitcoin, the Litecoin price is still following a bearish movement as the coin keeps trading below the 9-day and 21-day moving averages. Meanwhile, as the daily chart reveals, the Litecoin price is likely to cross below the lower boundary of the channel to confirm the bearish movement.

However, as the Relative Strength Index (14) reveals, the signal line is seen pointing to the downside but a bullish move may likely push the market back to the resistance level of 3800 SAT with a possible break above the 9-day and 21-day moving averages. More so, any further bullish movement above this barrier could hit the resistance level of 4100 SAT and above. On the contrary, if the Litecoin price crosses below the lower boundary of the channel, it could reach the support level of 3400 SAT and below.
Looking to buy or trade Litecoin (LTC) now? Invest at eToro!
67% of retail investor accounts lose money when trading CFDs with this provider
Read more:
Source: https://insidebitcoins.com/news/litecoin-price-prediction-ltc-usd-moves-below-180
- "
- analysis
- around
- bearish
- Bitcoin
- Bullish
- buy
- Cause
- Coin
- cryptocurrency
- Current
- Drop
- experience
- facing
- HTTPS
- index
- investor
- IT
- Level
- Line
- Litecoin
- Litecoin (LTC)
- Litecoin price
- LTC
- LTC/USD
- Market
- money
- move
- moves
- prediction
- price
- Price Prediction
- retail
- So
- South
- stay
- support
- support level
- Technical
- Technical Analysis
- technical support
- time
- touch
- trade
- Traders
- Trading
- within
- writing