Litecoin Price Prediction – June 24
The Litecoin price may likely settle above the 9-day and 21-day moving averages as the Relative Strength Index (14) moves toward 40-level.
LTC/USD Market
Key Levels:
Resistance levels: $175, $195, $215
Support levels: $80, $60, $40

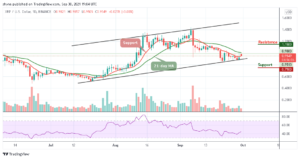
LTC/USD trades above the 9-day and 21-day moving averages within the channel. However, the Litecoin price is now trying to create an uptrend since yesterday, and should the buyers keep the movement above the 9-day and 21-day moving averages, the coin might resume the upward movement. Today, an early trading session touches the $137.40 level before rebounding to where it is trading currently at $136.38.
Litecoin Price Prediction: Will Litecoin Price Target $150 Level?
The Litecoin price needs to cross above the 9-day and 21-day MAs; therefore, if the resistance level of $150 gives way, the bull-run may come to focus. At the time of writing, the bullish movement seems more dominant as buyers continue to post strong commitments into the market. For the past few hours, we could see a sharp rise in the market price and if the coin stays above the $140 resistance level, this could further strengthen the market to hit the potential resistance levels of $175, $195, and $215.
On the downside, a lower possible swing may likely retest the previous support below the lower boundary of the channel. However, if the bears manage to fuel the market, traders may expect a further drop to $80, $60, and $40 support levels. On the other hand, the technical indicator Relative Strength Index (14) is now moving to cross above 40-level, indicating that the market may maintain the bullish movement if it comes to play.
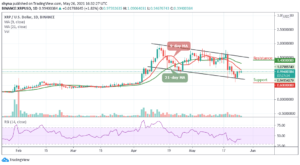
Comparing with Bitcoin, the Litecoin price keeps operating below the 9-day and 21-day moving averages. However, if the bullish movement continues, the resistance level of 4500 SAT is expected to be visited; although there might not be any reason to expect the long-term bullish reversal as the red-line of the 9-day MA is still below the green-line of the 21-day MA.

In other words, if the Litecoin price crosses below the lower boundary of the channel, it could refresh lows under 3600 SAT and a possible bearish continuation may likely meet the major support at 3400 SAT before falling to 3300 SAT and below while the buyers may push the coin to the potential resistance at 4600 SAT and above if the bulls successfully push the coin above the 9-day and 21-day MAs. Meanwhile, to support the bullish movement, the technical indicator Relative Strength Index (14) is recovering from the oversold region to give more bullish signals.
Looking to buy or trade Litecoin (LTC) now? Invest at eToro!
75% of retail investor accounts lose money when trading CFDs with this provider