Published 11 hours ago
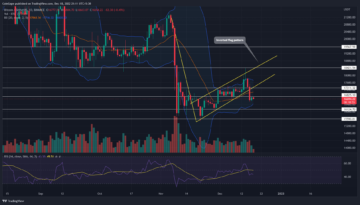
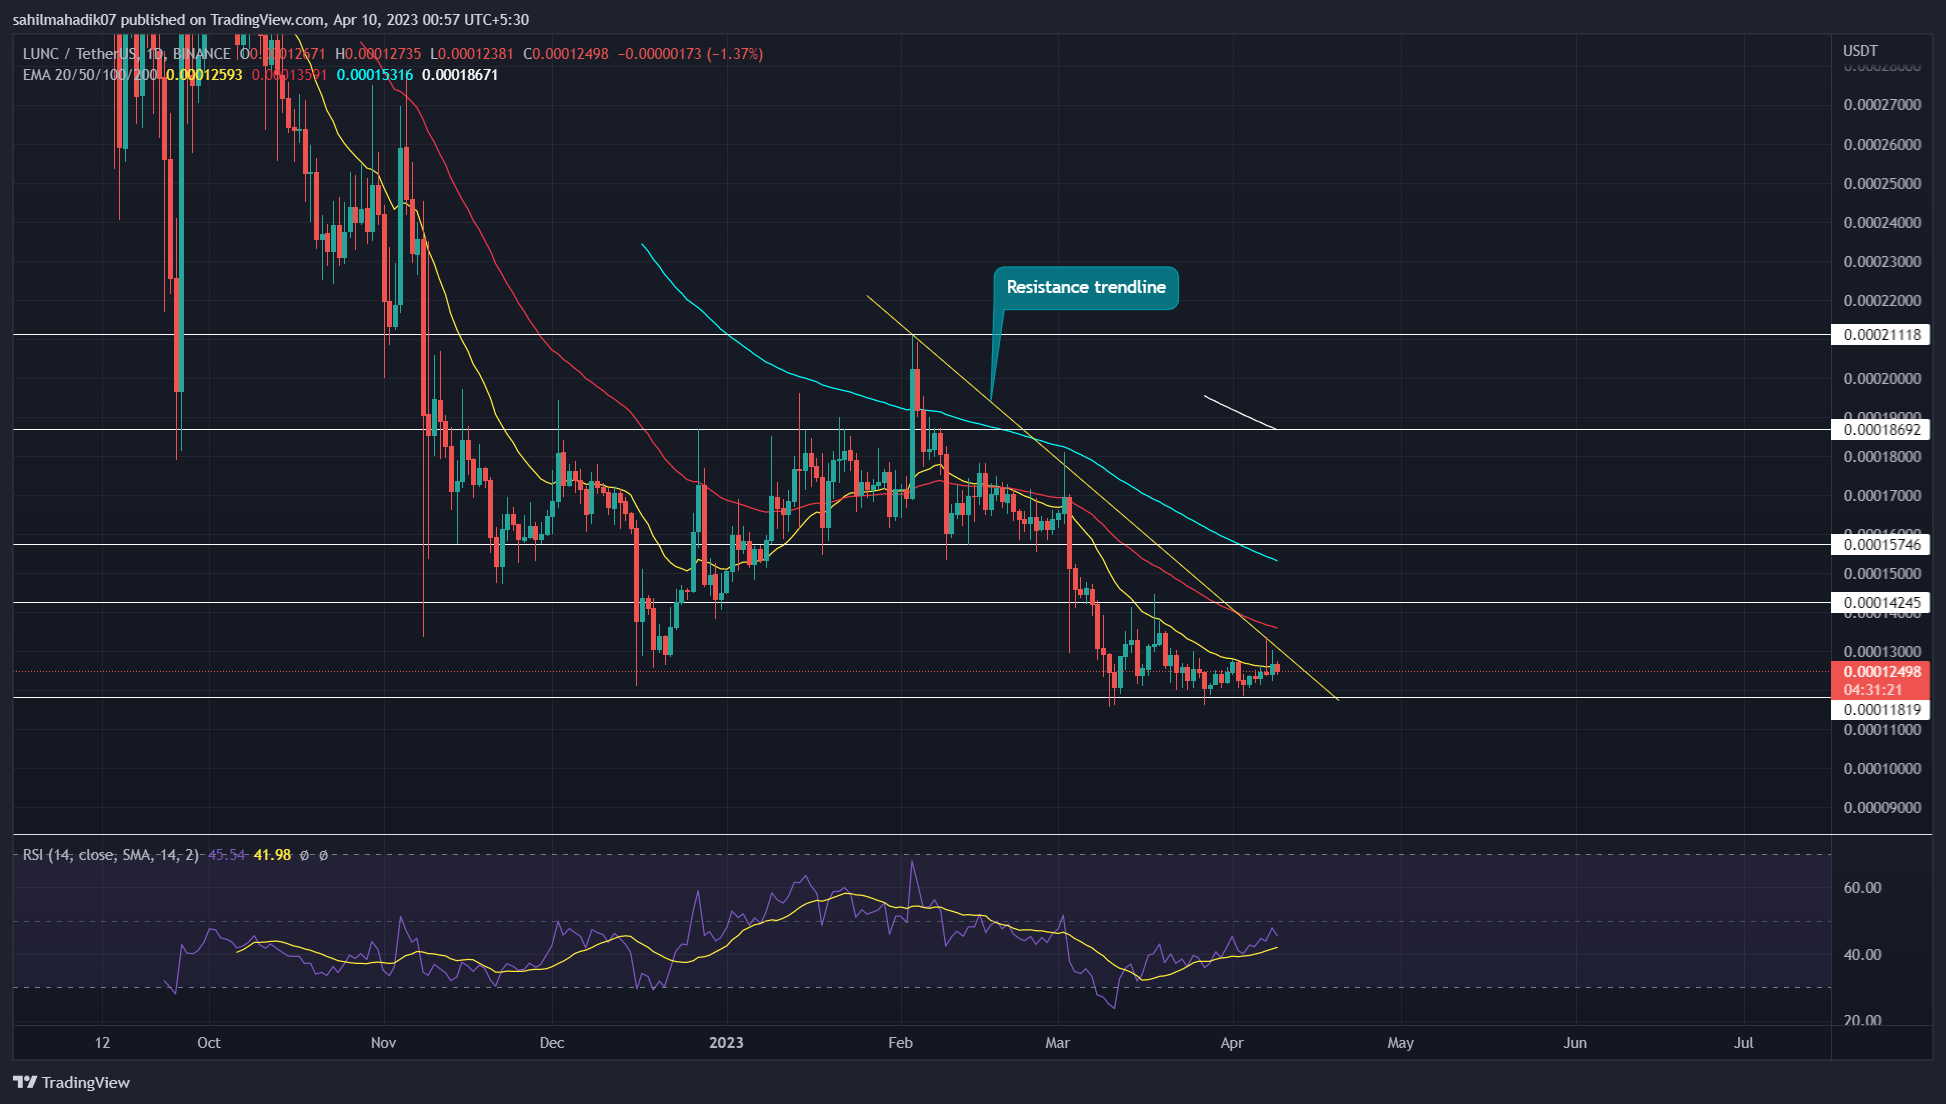
In the daily time frame chart, the higher price rejection candles observed at the resistance trendline indicate the traders continue to witness high selling pressure from it. Moreover, these rejection signs project a higher possibility for the LUNC price to prolong the prior downtrend. On the other side, the monthly support of $0.000118 stands as a strong accumulation zone to prevent further downfall and create a narrow sideways trend.
advertisement
Key Points:
- The area between the resistance trendline and $0.0000118 can be marked as a no-trading zone.
- A bullish divergence in the daily RSI increases the possibility of an overhead trendline breakout.
- The intraday trading volume in the LUNC coin is $89 Million, indicating a 101% gain.
Source- Tradingview
Responding to the indecisive market sentiment, the LUNC price has been moving sideways with minimal price movement for over a month. The daily chart showed short-body candles hovering above the $0.000118 support accentuating the growing uncertainty in the market.
Moreover, the traders are also responding to the descending trendline carrying the last two months’ downfall in LUNC price. As of now, this altcoin trades at the $0.000124 mark and has nearly reached the confluence point of the two aforementioned levels.
Trending Stories
Thus, the altcoin may soon break out from either of the mentioned levels and trigger a direction rally.
Also Read: What Is Regenerative Finance (Refi) And Who Is It For?
A potential breakout from the overhead trendline with a daily candle closing will be the key signal for a trend reversal to encourage buyers to reclaim lost ground. For a potential rally, the buyers may face significant resistance at $0.000142, $0.000157, or $0.000187.
On a contrary note, a breakdown below $0.000118 will prolong the prevailing downtrend.
Technical Indicators
RSI: Contrary to the sideways trend, the daily RSI slope shows evident growth indicating the rising buying pressure at $0.0000118 support, indicating a possibility for price reversal.
EMAs: the 20-day EMA acts as dynamic resistance to LUNC price.
LUNC Crypto Price Intraday Levels
- Spot rate: $0.000124
- Trend: loss
- Volatility: High
- Resistance level- $0.000142 and $0.000152
- Support level- $0.000118 and $0.0001
Share this article on:
advertisement
The presented content may include the personal opinion of the author and is subject to market condition. Do your market research before investing in cryptocurrencies. The author or the publication does not hold any responsibility for your personal financial loss.
<!– Close Story–>
- SEO Powered Content & PR Distribution. Get Amplified Today.
- Platoblockchain. Web3 Metaverse Intelligence. Knowledge Amplified. Access Here.
- Source: https://coingape.com/markets/lunc-price-coiling-up-for-a-potential-14-rise-is-it-a-good-time-to-enter/
- :is
- $UP
- 1
- 10
- 11
- 7
- 8
- 9
- a
- above
- accumulation
- acts
- Ad
- Altcoin
- and
- ARE
- AREA
- article
- AS
- At
- author
- avatar
- banner
- BE
- Beauty
- before
- below
- between
- binance
- blockchain
- Break
- break out
- Breakdown
- breakout
- Brian
- Bullish
- bullish divergence
- burn
- buyers
- Buying
- CAN
- Candles
- carrying
- Chart
- closing
- Coin
- Coingape
- COM
- condition
- content
- continue
- contrary
- create
- cryptocurrencies
- cryptocurrency
- daily
- different
- direction
- Divergence
- downfall
- dynamic
- either
- encourage
- Enter
- Entertainment
- Ether (ETH)
- Face
- Fashion
- finance
- financial
- follow
- For
- FRAME
- from
- further
- Gain
- good
- Ground
- Growing
- Growth
- Have
- High
- higher
- hold
- HOURS
- HTTPS
- i
- in
- include
- Including
- Increases
- indicate
- investing
- IT
- journalism
- jpg
- Key
- Last
- levels
- loss
- LUNC
- LUNC price
- mark
- marked
- Market
- market research
- market sentiment
- max-width
- mentioned
- million
- minimal
- Month
- monthly
- Moreover
- movement
- moving
- nearly
- of
- on
- Opinion
- Other
- past
- personal
- plato
- Plato Data Intelligence
- PlatoData
- plugin
- Point
- points
- possibility
- potential
- presented
- pressure
- prevent
- price
- Prior
- project
- Project A
- Publication
- rally
- Rate
- reached
- Read
- ReFi
- regenerative
- Regenerative Finance
- research
- Resistance
- responding
- responsibility
- Reversal
- Rise
- rising
- rsi
- Selling
- sentiment
- Share
- Shows
- sideways
- Signal
- significant
- Signs
- Soon
- stands
- strong
- subject
- support
- The
- These
- time
- to
- Topics
- Traders
- trades
- Trading
- trading volume
- TradingView
- Trend
- trending
- trigger
- Uncertainty
- variety
- volume
- WHO
- will
- with
- witness
- working
- written
- years
- Your
- zephyrnet