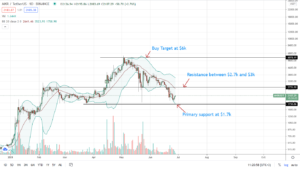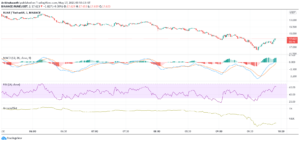
MATIC coin price falls lower to the psychological mark of $2 with increased trend momentum. Will bears break the rising channel? Polygon is described as a Layer 2 scaler, which implies that the project isn’t looking to improve its existing blockchain layer anytime very soon. The focus of the project is on reducing the complexity of scaling and quick blockchain transactions. Polygon is a combination of the Plasma Framework with the proof-of-stake blockchain. The Plasma framework utilized by Polygon was proposed by the co-founder of Ethereum, Vitalik Buterin. Ethereum allows for the quick execution of autonomous and scalable smart contracts. Let us move ahead to read about Polygon technical analysis. Past Performance of MATIC MATIC coin price fails to rise above the resistance zone at $2.45 as indicated in our previous technical analysis. The coin price shows a downfall of more than 15% in the 72 hours as it approaches the support trendline. Currently, the price rests close to the support trendline of the rising channel and the psychological support mark of $2. Therefore, the price is close to a support confluence that increases the chances of a reversal. MATIC/USD Daily Chart MATIC Technical Analysis The MATIC coin price gives a downfall after showing higher price rejection in the daily chart. Moreover, the price action hints at a head and shoulder pattern with the support trendline as its neckline. The coin price breaks below the crucial 50-day EMA as it struggles to find support near the 100-day EMA in the daily chart. However, the EMAs maintain a bullish alignment with the 200-day EMA ready to provide support below the rising channel pattern. The RSI indicator at 42% shows the slope giving a bearish crossover with the 14-day SMA as it breaks below the 50% line in the daily chart. Therefore, both the lines are within the nearly oversold zone, indicating a rise in underlying bearishness. The MACD indicator shows the MACD and signal line falling below the zero line as they fail to give a bullish crossover in the daily chart. Moreover, the bearish histograms regain momentum, indicating a rise in bearish momentum. From a technical perspective, the MATIC price action and the technical analysis suggest a possible fallout of the rising channel pattern. However, the 200-day EMA stands strong below the pattern to provide bullish support. Upcoming Trend The MATIC coin price might soon break below the crucial confluence support area in the daily chart. Moreover, the breakout will bring the fruition of the head and shoulder pattern in the daily chart. Therefore, traders can find selling opportunities at current prices with targets near the 200-day EMA. The MATIC coin price chart suggests the next support levels at $1.90 and the 200-day EMA. And, in case of a bullish reversal, the price can find resistance at $2.45 and $2.80. At press time, the technical analysis of MATIC coin by TradingView gives a “SELL” signal indicating a rise in bearish sentiments. Technical Analysis for MATICUSD
The post MATIC Technical Analysis: Price Falls to Support Trendline of Rising Channel appeared first on Cryptoknowmics-Crypto News and Media Platform.
- "
- About
- Action
- analysis
- AREA
- autonomous
- bearish
- Bearish Momentum
- Bears
- blockchain
- breakout
- Bullish
- Buterin
- chances
- Co-founder
- Co-Founder of Ethereum
- Coin
- combination
- contracts
- Current
- Display
- EMA
- ethereum
- fallout
- First
- Focus
- Framework
- Giving
- head
- HTTPS
- increased
- IT
- Line
- looking
- mark
- Matic
- Media
- Momentum
- move
- Near
- news
- opportunities
- Pattern
- performance
- perspective
- Polygon
- press
- price
- project
- Proof-of-Stake
- provide
- scaling
- smart
- Smart Contracts
- support
- Technical
- Technical Analysis
- time
- Traders
- Transactions
- us
- vitalik
- vitalik buterin
- within
- zero