Maker (MKR) is the governance token of the MakerDAO and Maker Protocol — respectively a decentralized organization and a software platform, both based on the Ethereum blockchain — that allows users to issue and manage the DAI stablecoin. Initially conceived in 2015 and fully launched in December 2017, Maker is a project whose task is to operate DAI, a community-managed decentralized cryptocurrency with a stable value soft-pegged to the US dollar. MakerDAO, the first entity inside the larger Maker ecosystem, was created in 2015 by Rune Christensen, an entrepreneur from Sealand, Denmark.
Let us look at the technical analysis of MKR.
Past Performance
MKR opened at $2,461.94 on October 27, 2021. The week witnessed an uptrend in the prices, after which it closed yesterday at $2,806.87. This was a weekly change of 14.01%. The 24hr low was $2481.21 while the 24hr high was $3,012.06.
MKR Technical Analysis
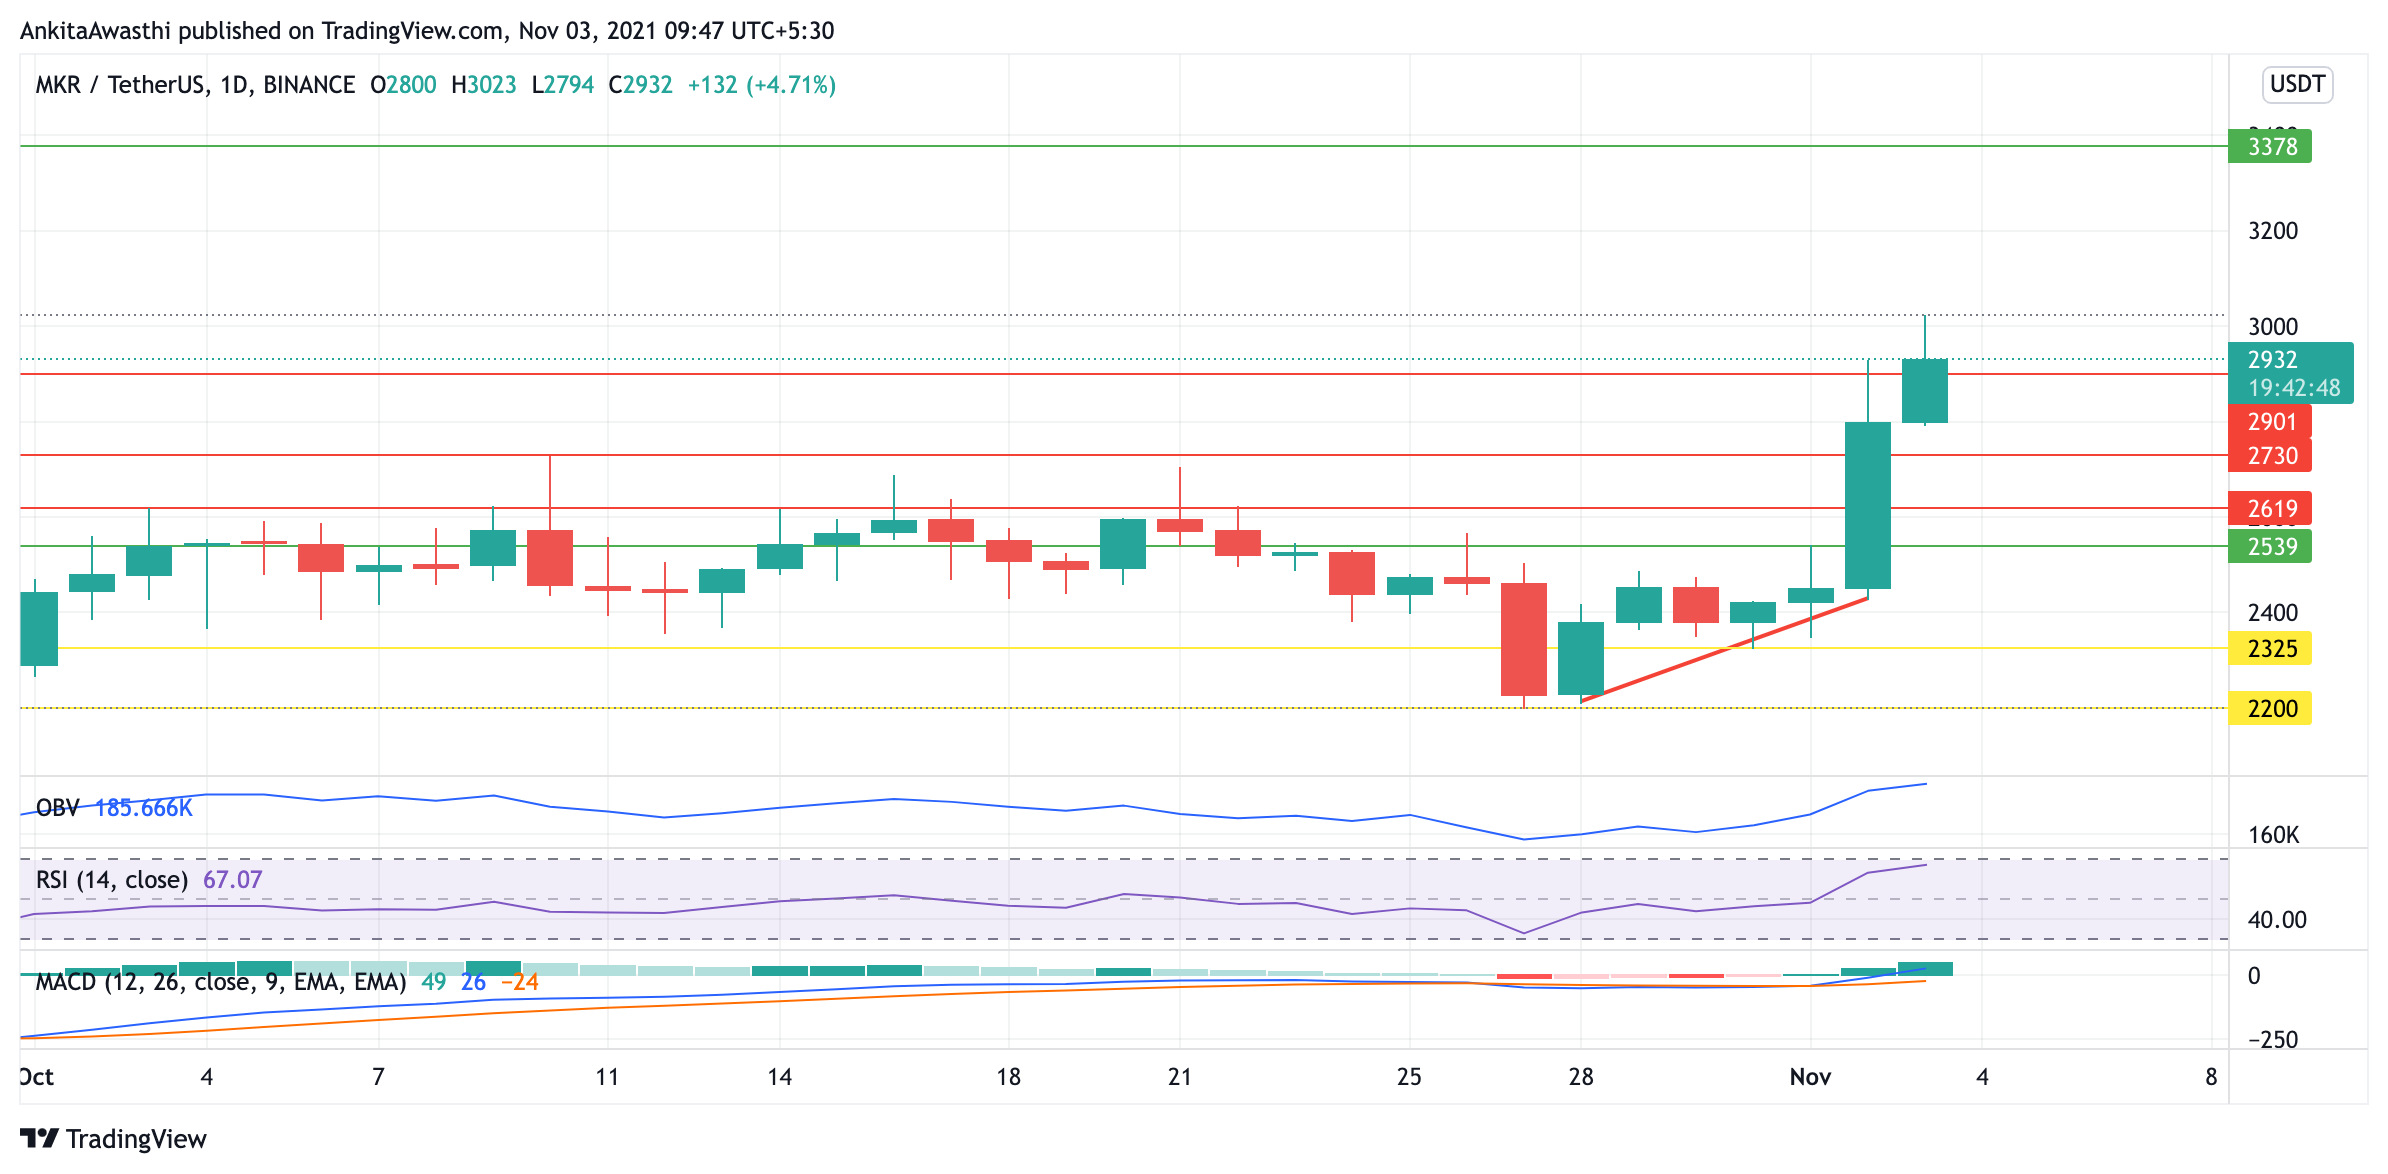
The bulls took a position of strength by taking support at $2200 owing to which the uptrend started. The price has successfully broken the previous resistance at $2,619, $2730, and $2901. The market is showing bullish signs even today as the current trading price of MKR is $2,946 which is 5.21% above the previous day’s close.
OBV is showing that the increased buying activity is putting pressure on the price to increase. This can be seen in the uptrend of the OBV graph.
The market cap of the MKR is increasing continuously for the last 24 hours, again showing bullish signals.
The RSI is again showing increasing strength of the price. It is currently at 67.22 and is close to the overbought region’s boundary at 70%. The traders need to be cautious here as a trend reversal may be seen if the RSI graph hits the overbought region.
Moving Average Convergence Divergence (MACD) is a trend-following momentum indicator that shows the relationship between two moving averages of a security’s price. Traders use the MACD to identify when bullish or bearish momentum is high in order to identify entry and exit points for trades.
MACD graph for MKR shows that the fast line and the slow line both are below the equilibrium, but moving in a positive direction. This is a bullish signal for MKR.
Day-Ahead and Tomorrow
The indicators are showing that the bulls are likely to dominate the market. Thus, the traders can take a long position while keeping their target at $3378 and the stoploss at $2539.
The FIB Numbers show the price is moving past the Fib pivot at $2728. The Fib level is at $3054.3.
- 67
- 7
- 9
- analysis
- bearish
- Bearish Momentum
- blockchain
- Bullish
- Bulls
- Buying
- change
- closed
- cryptocurrency
- Current
- DAI
- decentralized
- Denmark
- Dollar
- ecosystem
- Entrepreneur
- ethereum
- Ethereum blockchain
- Exit
- FAST
- First
- governance
- here
- High
- HTTPS
- identify
- Increase
- IT
- keeping
- Level
- Line
- Long
- maker
- MakerDao
- Market
- Market Cap
- MKR
- Momentum
- numbers
- order
- organization
- Pivot
- platform
- pressure
- price
- project
- protocol
- rune christensen
- security
- Signs
- Software
- stablecoin
- started
- support
- Target
- Technical
- Technical Analysis
- token
- Traders
- trades
- Trading
- us
- US Dollar
- users
- value
- week
- weekly