TL;DR Breakdown
- Monero price analysis shows a slight price improvement today.
- Resistance is currently found at $266.
- XMR/USD may retest the support of $252.
The Monero price analysis shows some bullish activity is taking place during recent hours. The XMR price has increased by some margin after the flash crash, as XMR/USD pair sets a higher low at $262. After the strong bearish tide of the last two days, bulls are struggling to preserve the support of $252. Despite the bullish efforts, the bearish strokes are proving overwhelmingly powerful.
Most of the top 40 altcoins are improving today after the recent downfall, and Monero is no different. Monero has also joined the altcoin trend and has shown a 2.2 percent increase in value today, while stile XMR has lost a value of overall 13.88 percent during the past week.
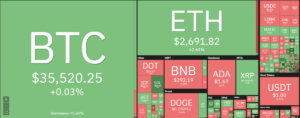
The cryptocurrency king Bitcoin is also down by 0.11 percent, but the unofficial queen Ethereum has gained 2.4 percent in the last 24 hours. The talk of the town about the queen getting out of the king’s shadow might be true.
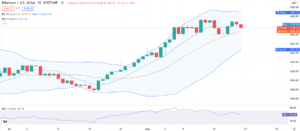
XMR/USD 1-day price chart: Bulls struggle to preserve $252 support
The 1-day Monero price analysis chart shows bulls are trying to save the support of the $252 as previous support of the $281 has already fallen. The XMR/USD pair is trading in the range of 255-$266.

The moving average (MA) has come down to the $291 mark crossing down the Bollinger bands average, which lies at the $296 mark. However, both averages are above the price level, which is a bearish indication.
The volatility increases as Bollinger bands widen up, and the upper Bollinger band is at the $332 level, whereas the lower band is at the $260 level. The relative strength index (RSI) is at 42 below the centerline as bearish momentum is still dominating.
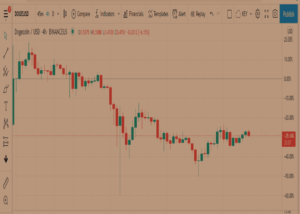
Monero 4-hour price analysis: XMR bulls eyes $266 resistance
The 4-hours Monero price analysis chart shows XMR is trading at $262 at the time of writing and moving up towards the resistance mark of $266. The target may or may not be achieved, as the overall trend favors bears.
There is a high possibility that bulls may be hanging on to the support present below at the $252 mark if price reversal happens, which is also possible if market pressure increases.

The moving average (MA) has crossed over the price and is at $260, while the Bollinger bands average is still above the price, i.e., at $279, indicating mixed market sentiment. The volatility is still on the higher side.
The Bollinger bands’ values are as follows; the upper band is at the $329 mark, and the lower band is at the $230 mark. The relative strength index (RSI) has moved further below during the past hours and is near the underbought limit at a score of 39.

Further looking into Monero price analysis the technical indicators chart for Monero price analysis is mostly bearish today. Out of 26 technical indicators, 13 are pointing towards the sell signal and only five towards the buy signal, whereas eight are neutral.
The moving averages are 11 on the selling side and only three on the buying side, whereas only one stands neutral. The oscillators are perfectly neutral for today as seven show a neutral sign, and two are on the buying and selling sides.
Moneo price analysis: Conclusion
Looking at the above 1-day and 4-hours charts and all the technical data available for Monero price analysis, the day holds fears and hopes for intraday traders as price movement is a little on the bullish side with huge bearish clouds. Though after the recent flash crash, there is enough space for XMR bulls to push through but technically, bearish momentum is still in the lead.
Disclaimer. The information provided is not trading advice. Cryptopolitan.com holds no liability for any investments made based on the information provided on this page. We strongly recommend independent research and/or consultation with a qualified professional before making any investment decisions.
Source: https://api.follow.it/track-rss-story-click/v3/tHfgumto13AUn0lbyBONlVyOSYGFl6uu
- 11
- 39
- advice
- All
- Altcoins
- analysis
- bearish
- Bearish Momentum
- Bears
- Bullish
- Bulls
- buy
- Buying
- Charts
- Crash
- cryptocurrency
- data
- day
- fears
- Flash
- High
- HTTPS
- huge
- Increase
- index
- information
- investment
- Investments
- King
- lead
- Level
- liability
- Making
- mark
- Market
- mixed
- Momentum
- Monero
- Near
- present
- pressure
- price
- Price Analysis
- range
- research
- sell
- sentiment
- Shadow
- Space
- support
- Target
- Technical
- Tide
- time
- top
- Traders
- Trading
- value
- Volatility
- writing
- XMR