Introduction
Have you experienced the frustration of a well-performing model in training and evaluation performing worse in the production environment? It’s a common challenge faced in the production phase, and that is where Evidently.ai, a fantastic open-source tool, comes into play to make our ML model observable and easy to monitor. This guide will cover the reasons behind changes in data and model performance in the production environment and the necessary actions to implement. We will also learn how to integrate this tool with the Streamlit prediction app. Let’s start our remarkable journey.
This article was published as a part of the Data Science Blogathon.
Table of contents
Necessary Prerequisites
1) Clone the repository
git clone "https://github.com/VishalKumar-S/Flight-Delay-Prediction-and-live-Monitoring-with-Azure-Evidently-and-Streamlit-with-MVC-Architecture.git"2) Create and activate the virtual environment
#create a virtual environment
python3 -m venv venv
#Activate your virtual environmnent in your project folder
source venv/bin/activate
# This command installs Python packages listed in the requirements.txt file.
pip install -r requirements.txt4)Install Streamlit and Evidently
pip install streamlit
pip install evidently
Project Structure:
project_root/
│
├── assets/
│
├── data/
│ └── Monitoring_data.csv
│
├── models/
│ ├── best_model.pkl
│ ├── lightgml_model.pkl
│ ├── linear_regression_model.pkl
│ ├── random_forest_model.pkl
│ ├── ridge_regression.pkl
│ ├── svm_model.pkl
│ └── xgboost_model.pkl
│
├── notebooks/
│ └── EDA.ipynb
│
├── src/
│ ├── controller/
│ │ └── flight_delay_controller.py
│ │
│ ├── model/
│ │ └── flight_delay_model.py
│ │
│ ├── view/
│ │ └── flight_delay_view.py
│ │
│ ├── data_preprocessing.py
│ ├── model_evaluation.py
│ └── modeling.py
│
├── .gitignore
├── Dockerfile
├── LICENSE
├── Readme.md
├── app.py
└── requirements.txt
Data Preprocessing
Fetching from the Cloud
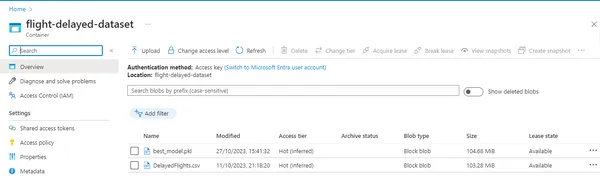
In this project, we will fetch the dataset from Azure. First, we will create a storage container in Azure, then blob storage, then upload our raw dataset there, make it publicly accessible, and use it for future data preprocessing steps.
Dataset link: https://www.kaggle.com/datasets/giovamata/airlinedelaycauses
Here is the code snippet to fetch from the cloud,
class DataPreprocessorTemplate: """ Template method pattern for data preprocessing with customizable steps. """ def __init__(self, data_url): """ Initialize the DataPreprocessor Template with the data URL including the SAS token. Args: data_url (str): The URL to the data with the SAS token. """ self.data_url = data_url def fetch_data(self): """ Fetch data from Azure Blob Storage. Returns: pd.DataFrame: The fetched dataset as a Pandas DataFrame. """ try: # Fetch the dataset using the provided URL print("Fetching the data from cloud...") data = pd.read_csv(self.data_url) return data except Exception as e: raise Exception("An error occurred during data retrieval: " + str(e)) def main(): # URL to the data including the SAS token data_url = "https://flightdelay.blob.core.windows.net/flight-delayed-dataset/DelayedFlights.csv" output_path = "../data/cleaned_flight_delays.csv" data_preprocessor = DataPreprocessorTemplate(data_url) data = data_preprocessor.fetch_data() cleaned_data=data_preprocessor.clean_data(data) data_preprocessor.save_cleaned_data(cleaned_data, output_path) Azure Image:
Data Cleaning and Transformation
In the data world, data transformation transforms the raw diamonds into polished ones. Here, we will proceed with all the data preprocessing steps, such as removing unwanted features, imputing missing values, encoding categorical columns, and removing outliers. Here we have implemented dummy encoding. Then, we will remove the outliers using the Z-score test.
Data Cleaning code snippet:
def clean_data(self,df): """ Clean and preprocess the input data. Args: df (pd.DataFrame): The input dataset. Returns: pd.DataFrame: The cleaned and preprocessed dataset. """ print("Cleaning data...") df=self.remove_features(df) df=self.impute_missing_values(df) df=self.encode_categorical_features(df) df=self.remove_outliers(df) return df def remove_features(self,df): """ Remove unnecessary columns from the dataset. Args: df (pd.DataFrame): The input dataset. Returns: pd.DataFrame: The dataset with unnecessary columns removed. """ print("Removing unnecessary columns...") df=df.drop(['Unnamed: 0','Year','CancellationCode','TailNum','Diverted','Cancelled','ArrTime','ActualElapsedTime'],axis=1) return df def impute_missing_values(self,df): """ Impute missing values in the dataset. Args: df (pd.DataFrame): The input dataset. Returns: pd.DataFrame: The dataset with missing values imputed. """ print("Imputing missing values...") delay_colns=['CarrierDelay', 'WeatherDelay', 'NASDelay', 'SecurityDelay', 'LateAircraftDelay'] # Impute missing values with the 0 for these columns df[delay_colns]=df[delay_colns].fillna(0) # Impute missing values with the median for these columns columns_to_impute = ['AirTime', 'ArrDelay', 'TaxiIn','CRSElapsedTime'] df[columns_to_impute]=df[columns_to_impute].fillna(df[columns_to_impute].median()) return df def encode_categorical_features(self,df): """ Encode categorical features in the dataset. Args: df (pd.DataFrame): The input dataset. Returns: pd.DataFrame: The dataset with categorical features encoded. """ print("Encoding categorical features...") df=pd.get_dummies(df,columns=['UniqueCarrier', 'Origin', 'Dest'], drop_first=True) return df def remove_outliers(self,df): """ Remove outliers from the dataset. Args: df (pd.DataFrame): The input dataset. Returns: pd.DataFrame: The dataset with outliers removed. """ print("Removing outliers...") z_threshold=3 z_scores=np.abs(stats.zscore(df[self.numerical_columns])) outliers=np.where(z_scores>z_threshold) df_no_outliers=df[(z_scores<=z_threshold).all(axis=1)] print("Shape after data cleaning:", df_no_outliers.shape) return df_no_outliers
Then, we will save the cleaned dataset for our future model training and evaluation purposes. We will use joblib to save the cleaned dataset.
Here is the code snippet:
def save_cleaned_data(self,cleaned_data, output_path): """ Save the cleaned data to a CSV file. Args: cleaned_data (pd.DataFrame): The cleaned dataset. output_path (str): The path to save the cleaned data. """ print("Saving cleaned data...") cleaned_data.to_csv(output_path,index=False)Training and Evaluation
After data cleaning, we will split our dataset into 2 components – train and test set. Then, we will train multiple regression models like Linear Regression, Random Forest regressor, xgboost, ridge regression, and lightgbm models. Then, we will save all the files as .pkl files using joblib, which reduces the time and optimizes additional resource usage.
Now, we can use this trained model file for evaluation and prediction purposes. Then, we will evaluate the model based on evaluation metrics such as R2 score, MAE (Mean Absolute Error) value, and RMSE (Root Mean Squared Error) value. Then, save the best-performing model to use it for deployment.
Code snippet for Model Training :
# Function to create machine learning models
def create_model(model_name): if model_name == "random_forest": return RandomForestRegressor(n_estimators=50, random_state=42) elif model_name == "linear_regression": return LinearRegression() elif model_name == "xgboost": return xgb.XGBRegressor() elif model_name == "ridge_regression": return Ridge(alpha=1.0) # Adjust alpha as needed elif model_name == "lightgbm": return lgb.LGBMRegressor() # Load the cleaned dataset
print("Model loading started...")
cleaned_data = pd.read_csv("../data/cleaned_flight_delays.csv")
print("Model loading completed") # Define the target variable (ArrDelay) and features (X)
target_variable = "ArrDelay"
X = cleaned_data.drop(columns=[target_variable])
y = cleaned_data[target_variable] # Split the data into training and testing sets
print("Splitting the data into training and testing sets...")
X_train, X_test, y_train, y_test = train_test_split(X, y, test_size=0.2, random_state=42)
print("Data split completed.")
# Function to train and save a model
def train_and_save_model(model_name, X_train, y_train): model = create_model(model_name) print(f"Training the {model_name} model...") start_time = time.time() model.fit(X_train, y_train) print("Model training completed...") end_time = time.time() elapsed_time = end_time - start_time print(f"Training time taken to complete: {elapsed_time:.2f} seconds") # Save the trained model for later use joblib.dump(model, f"../models/{model_name}_model.pkl") print(f"{model_name} model saved as {model_name}_model.pkl") # Create and train Random Forest model
train_and_save_model("random_forest", X_train, y_train) # Train the linear regression model
train_and_save_model("linear_regression", X_train, y_train) # Create and train XGBoost model
train_and_save_model("xgboost", X_train, y_train) # Create and train ridge regression model
train_and_save_model("ridge_regression", X_train, y_train) # Create and train lightgbm model
train_and_save_model("lightgbm", X_train, y_train)
Code snippet for Model Evaluation
# Load the cleaned dataset
cleaned_data = pd.read_csv("../data/cleaned_flight_delays.csv") # Load the trained machine learning models
random_forest_model = joblib.load("../models/random_forest_model.pkl")
linear_regression_model = joblib.load("../models/linear_regression_model.pkl")
xgboost_model = joblib.load("../models/xgboost_model.pkl")
ridge_regression_model = joblib.load("../models/ridge_regression_model.pkl")
lightgbm_model = joblib.load("../models/lightgbm_model.pkl") # Define the target variable (ArrDelay) and features (X)
target_variable = "ArrDelay"
X = cleaned_data.drop(columns=[target_variable])
y = cleaned_data[target_variable] # Split the data into training and testing sets
X_train, X_test, y_train, y_test = train_test_split(X, y, test_size=0.2, random_state=42) # Define a function to evaluate models
def evaluate_model(model, X_test, y_test): y_pred = model.predict(X_test) mae = mean_absolute_error(y_test, y_pred) mse = mean_squared_error(y_test, y_pred) r2 = r2_score(y_test, y_pred) return mae, mse, r2 # Create a dictionary of models to evaluate
models = { "Random Forest": random_forest_model, "Linear Regression": linear_regression_model, "XGBoost": xgboost_model, "Ridge Regression": ridge_regression_model, "LightGBM": lightgbm_model,
} # Evaluate each model and store their metrics
metrics = {}
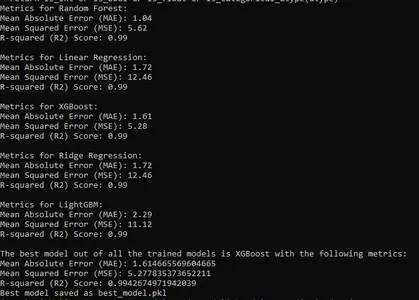
for model_name, model in models.items(): mae, mse, r2 = evaluate_model(model, X_test, y_test) metrics[model_name] = {"MAE": mae, "MSE": mse, "R2": r2} # Print the evaluation metrics for all models
for model_name, model_metrics in metrics.items(): print(f"Metrics for {model_name}:") print(f"Mean Absolute Error (MAE): {model_metrics['MAE']:.2f}") print(f"Mean Squared Error (MSE): {model_metrics['MSE']:.2f}") print(f"R-squared (R2) Score: {model_metrics['R2']:.2f}") print()
After evaluation, we will choose the best deployment model.
Code snippet to save and print the best model:
# Find the best model based on R2 score
best_model = max(metrics, key=lambda model: metrics[model]["R2"]) # Print the results
print(f"The best model out of all the trained models is {best_model} with the following metrics:")
print(f"Mean Absolute Error (MAE): {metrics[best_model]['MAE']}")
print(f"Mean Squared Error (MSE): {metrics[best_model]['MSE']}")
print(f"R-squared (R2) Score: {metrics[best_model]['R2']}") # Save the best model for later use
joblib.dump(models[best_model], "../models/best_model.pkl")
print("Best model saved as best_model.pkl")
Output:
Evidently: For Data and Model Monitoring
In the production environment, various factors can go wrong with the proper functioning of the model. Some of the key considerations are:
- Training-serving skew: This happens when there is a significant difference between the data we use for training and experiments.
- Data Quality and Integrity Issues: There might be data processing issues like – broken pipelines, infrastructure issues, changes in the data schema, or any other data issues from the source.
- Broken Upstream Model: In the production environment, models often form a chain, where the input of one model depends on the output of the other. So, any issue in the output of one model will influence the overall model’s prediction.
To evaluate the data and model quality, we will consider 2 datasets- the reference and current datasets.
Reference Dataset: This dataset is a benchmark for the current dataset quality metrics. Although default threshold values are chosen by Evidently, based on our reference dataset, we can also provide customized metric threshold values based on our specific needs.
Current Dataset: It represents the live unknown data taken for evaluation.
We will calculate the Data drift, Target drift, Data quality, and model performance reports with these two datasets.
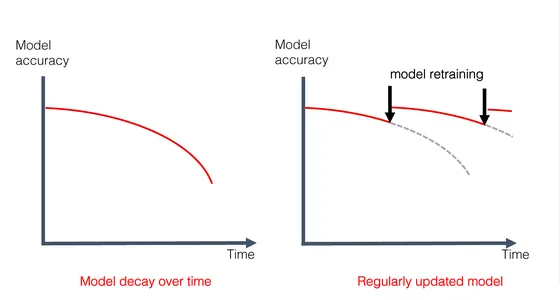
Reports will cover data drift, target drift, data quality, and model performance metrics. Usually, monitoring occurs at specific intervals in batches.
Things to consider before retraining the model:
1. Check for Data Drift: If data drift is detected, it is advised to check for data quality first and check for any external factors influencing the drift, such as pandemics and natural calamities.
2. Evaluate Model Performance: Consider the model performance after addressing the data drift issues. If data and model reports show drift, re-training the model may be a good idea. Before taking this decision, consider the third point.
3. Re-training Consideration: Re-training isn’t always the solution. We will not have enough new data to retrain the model in many situations. Be cautious about training with new data since there are also chances of data being unstable and wrong for specific reasons.
4. Setting alerts for Data Drift: Before setting warnings for data drifts, analyze the importance of that specific data/feature on the prediction. Not all data drifts are important, and actions need to be taken. Always analyze the importance of each feature’s influence on the prediction.
Reports can be generated in various formats, such as HTML, JPEG, JSON, etc. Let us explore the code snippet to generate the reports.
Model Performance Report Code Snippet
# Creating a regression performance report object
regression_performance_report = Report(metrics=[RegressionPreset()]) # Running the regression performance report
regression_performance_report.run( reference_data=reference, # Reference dataset for comparison current_data=current.loc[CUR_WEEK_START:CUR_WEEK_END], # Current dataset for analysis column_mapping=column_mapping # Mapping between columns in reference and current datasets
) # Specifying the path to save the model performance report HTML file
model_performance_report_path = reports_dir / 'model_performance.html' # Saving the regression performance report as an HTML file
regression_performance_report.save_html(model_performance_report_path)
Target drift Code snippet
# Creating a target drift report object
target_drift_report = Report(metrics=[TargetDriftPreset()]) # Running the target drift report
target_drift_report.run( reference_data=reference, # Reference dataset for comparison current_data=current.loc[CUR_WEEK_START:CUR_WEEK_END], # Current dataset for analysis column_mapping=column_mapping # Mapping between columns in reference and current datasets
) # Specifying the path to save the target drift report HTML file
target_drift_report_path = reports_dir / 'target_drift.html' # Saving the target drift report as an HTML file
target_drift_report.save_html(target_drift_report_path)
Data Drift
# Creating a column mapping object
column_mapping = ColumnMapping()
column_mapping.numerical_features = numerical_features # Defining numerical features for mapping # Creating a data drift report object
data_drift_report = Report(metrics=[DataDriftPreset()]) # Running the data drift report
data_drift_report.run( reference_data=reference, # Reference dataset for comparison current_data=current.loc[CUR_WEEK_START:CUR_WEEK_END], # Current dataset for analysis column_mapping=column_mapping # Mapping between numerical features in reference and current datasets
) # Specifying the path to save the data drift report HTML file
data_drift_report_path = reports_dir / 'data_drift.html' # Saving the data drift report as an HTML file
data_drift_report.save_html(data_drift_report_path) column_mapping = ColumnMapping()
column_mapping.numerical_features = numerical_features
data_drift_report = Report(metrics=[DataDriftPreset()])
data_drift_report.run( reference_data=reference, current_data=current.loc[CUR_WEEK_START:CUR_WEEK_END], column_mapping=column_mapping
)
data_drift_report_path = reports_dir / 'data_drift.html'
data_drift_report.save_html(data_drift_report_path)
Data Quality Code snippet
# Creating a column mapping object
column_mapping = ColumnMapping()
column_mapping.numerical_features = numerical_features # Defining numerical features for mapping # Creating a data quality report object
data_quality_report = Report(metrics=[DataQualityPreset()]) # Running the data quality report
data_quality_report.run( reference_data=reference, # Reference dataset for comparison current_data=current.loc[CUR_WEEK_START:CUR_WEEK_END], # Current dataset for analysis column_mapping=column_mapping # Mapping between numerical features in reference and current datasets
) # Specifying the path to save the data quality report HTML file
data_quality_report_path = reports_dir / 'data_quality.html' # Saving the data quality report as an HTML file
data_quality_report.save_html(data_quality_report_path)
Explore Model-View-Controller (MVC) Architecture
Let us learn about the MVC architecture in this section:-
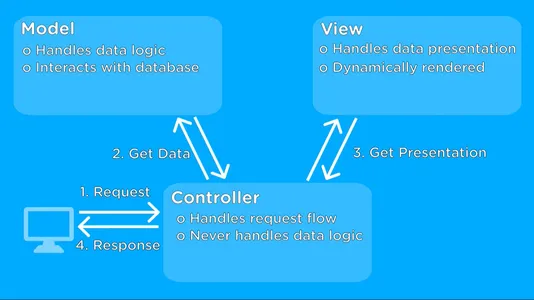
The Model-View-Controller (MVC) architecture is a design pattern used in web apps. It is used to streamline the code complexity and enhance the code readability. Let us see its components.
Model: The Logic
The Model component represents the core logic of our application. It handles data processing and machine learning model interactions. The Model script is located in the src/model/ directory.
View: Building User Interfaces
The View component is responsible for creating the user interface. It interacts with the user and displays information. The View script is in the src/view/ directory.
Controller: The Orchestrating bridge
The Controller component acts as an intermediate bridge between the Model and View components. It handles user input and requests. The Controller script is located in the src/controller/ directory.
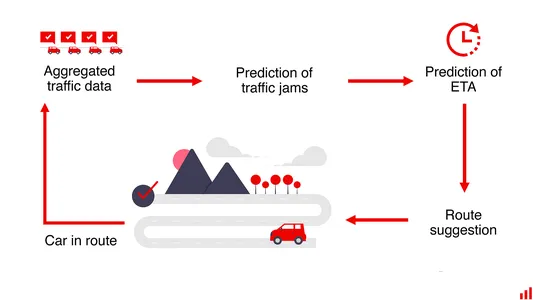
MVC Diagram:
Below is a visual representation of the MVC architecture:
Let us see the code snippet for predicting delays in MVC architecture:
1) Model (flight_delay_model.py):
# Import necessary libraries and modules
import pandas as pd
import joblib
import xgboost as xgb
from typing import Dict class FlightDelayModel: def __init__(self, model_file="models/best_model.pkl"): """ Initialize the FlightDelayModel. Args: model_file (str): Path to the trained model file. """ # Load the pre-trained model from the provided file self.model = joblib.load(model_file) def predict_delay(self, input_data: Dict): """ Predict flight delay based on input data. Args: input_data (Dict): A dictionary containing input features for prediction. Returns: float: The predicted flight delay. """ # Convert the input data dictionary into a DataFrame for prediction input_df = pd.DataFrame([input_data]) # Use the pre-trained model to make a prediction prediction = self.model.predict(input_df) return prediction
2) View (flight_delay_view.py):
import streamlit as st
from typing import Dict class FlightDelayView: def display_input_form(self): """ Display the input form in the Streamlit sidebar for users to input data. """ st.sidebar.write("Input Values:") # Coding part to create input form elements will be here def display_selected_inputs(self, selected_data: Dict): """ Display the selected input values based on user input. Args: selected_data (Dict): A dictionary containing selected input values. Returns: Dict: The same dictionary with selected values for reference. """ # Coding part to display selected input values will be here # Display selected input values, such as sliders, number inputs, and select boxes return selected_data def display_predicted_delay(self, flight_delay): """ Display the predicted flight delay to the user. Args: flight_delay: The predicted flight delay value. """ # Coding part to display the predicted delay will be here # Display the predicted flight delay value to the user
3) Controller (flight_delay_controller.py):
import streamlit as st
from src.view.flight_delay_view import FlightDelayView
from src.model.flight_delay_model import FlightDelayModel
from typing import Dict class FlightDelayController: def __init__(self): self.model = FlightDelayModel() self.view = FlightDelayView() self.selected_data = self.model.selected_data() def run_prediction(self): # Display the input form, collect user inputs, and display the selected inputs self.view.display_input_form() input_data = self.get_user_inputs() self.view.display_selected_inputs(input_data) if st.button("Predict Flight Delay"): # When the prediction button is clicked, predict flight delay and display the result flight_delay = self.model.predict_delay(input_data) self.view.display_predicted_delay(flight_delay) def get_user_inputs(self): # Coding part to collect user inputs from Streamlit sidebar will be here. user_inputs = {} # Create an empty dictionary to store user inputs # You can use Streamlit's sidebar widgets to collect user inputs, e.g., st.sidebar.slider, st.sidebar.selectbox, etc. # Here, you can add code to collect user inputs and populate the 'user_inputs' dictionary. # Example: # user_inputs['selected_feature'] = st.sidebar.slider("Select Feature", min_value, max_value, default_value) # Repeat this for each user input you want to collect. return user_inputs # Return the dictionary containing user inputs
Integration of Prediction and Monitoring with Streamlit
Here, we will integrate the Evidently monitoring with Streamlit prediction to allow users to make predictions and monitor the data and model.
This approach allows users to predict, monitor, or both, written seamlessly, by following the MVC architecture design pattern.
Code:
Code snippet of selecting the reference and current dataset, implemented in src/flight_delay_Controller.py
# Importing necessary libraries
import streamlit as st
import pandas as pd
import time class FlightDelayController: def run_monitoring(self): # Streamlit application title and introduction st.title("Data & Model Monitoring App") st.write("You are in the Data & Model Monitoring App. Select the Date and month range from the sidebar and click 'Submit' to start model training and monitoring.") # Allow the user to choose their preferred date range new_start_month = st.sidebar.selectbox("Start Month", range(1, 12), 1) new_end_month = st.sidebar.selectbox("End Month", range(1, 12), 1) new_start_day = st.sidebar.selectbox("Start Day", range(1, 32), 1) new_end_day = st.sidebar.selectbox("End Day", range(1, 32), 30) # If the user clicks the "Submit" button if st.button("Submit"): st.write("Fetching your current batch data...") # Measure the time taken to fetch the data data_start = time.time() df = pd.read_csv("data/Monitoring_data.csv") data_end = time.time() time_taken = data_end - data_start st.write(f"Fetched the data within {time_taken:.2f} seconds") # Filter data based on the selected date range date_range = ( (df['Month'] >= new_start_month) & (df['DayofMonth'] >= new_start_day) & (df['Month'] <= new_end_month) & (df['DayofMonth'] <= new_end_day) ) # Create the reference and current dataset from the date range. reference_data = df[~date_range] current_data = df[date_range]
After choosing the reference and current datasets, we will generate reports for data drift, data quality, model quality, and target drift. The code to implement report generation is split into 3 parts per the MVC architecture design. Let us see the code in these 3 files.
Code snippet for flight_delay_Controller.py
import streamlit as st
from src.view.flight_delay_view import FlightDelayView
from src.model.flight_delay_model import FlightDelayModel
import numpy as np
import pandas as pd
from scipy import stats
import time # Controller
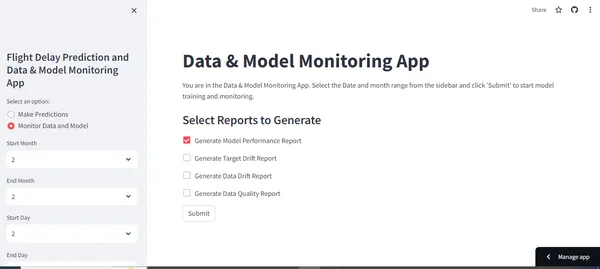
class FlightDelayController: """ The Controller component for the Flight Delay Prediction App. This class orchestrates the interaction between the Model and View components. """ def __init__(self): # Initialize the controller by creating instances of the Model and View. self.model = FlightDelayModel() # Create an instance of the FlightDelayModel. self.view = FlightDelayView() # Create an instance of the FlightDelayView. self.selected_data = self.model.selected_data() # Get selected data from the model. self.categorical_options = self.model.categorical_features() # Get categorical features from the model. def run_monitoring(self): # Function to run the monitoring application. # Set the title and a brief description. st.title("Data & Model Monitoring App") st.write("You are in the Data & Model Monitoring App. Select the Date and month range from the sidebar and click 'Submit' to start model training and monitoring.") # Select which reports to generate using checkboxes. st.subheader("Select Reports to Generate") generate_model_report = st.checkbox("Generate Model Performance Report") generate_target_drift = st.checkbox("Generate Target Drift Report") generate_data_drift = st.checkbox("Generate Data Drift Report") generate_data_quality = st.checkbox("Generate Data Quality Report") if st.button("Submit"): # 'date_range' and 'df' is not shown here since all those are already shown in the previous code snippets # Reference data without the selected date range. reference_data = df[~date_range] # Current data within the selected date range. current_data = df[date_range] self.view.display_monitoring(reference_data, current_data) # Display monitoring data. self.model.train_model(reference_data, current_data) # Train the model. # Generate selected reports and display them. if generate_model_report: st.write("### Model Performance Report") st.write("Generating Model Performance Report...") performance_report = self.model.performance_report(reference_data, current_data) self.view.display_report(performance_report, "Model Performance Report") if generate_target_drift: st.write("### Target Drift Report") st.write("Generating Target Drift Report...") target_report = self.model.target_report(reference_data, current_data) self.view.display_report(target_report, "Target Drift Report") if generate_data_drift: st.write("### Data Drift Report") st.write("Generating Data Drift Report...") data_drift_report = self.model.data_drift_report(reference_data, current_data) self.view.display_report(data_drift_report, "Data Drift Report") if generate_data_quality: st.write("### Data Quality Report") st.write("Generating Data Quality Report...") data_quality_report = self.model.data_quality_report(reference_data, current_data) self.view.display_report(data_quality_report, "Data Quality Report")
Code for Flight_delay_model.py
import pandas as pd
import joblib
import xgboost as xgb
from evidently.pipeline.column_mapping import ColumnMapping
from evidently.report import Report
from evidently.metric_preset import DataDriftPreset
from evidently.metric_preset import TargetDriftPreset
from evidently.metric_preset import DataQualityPreset
from evidently.metric_preset.regression_performance import RegressionPreset
import time
import streamlit as st
from typing import Dict # Model
class FlightDelayModel: """ The Model component for the Flight Delay Prediction App. This class handles data loading, model loading, and delay predictions. """ def __init__(self, model_file="models/best_model.pkl"): # Initialize the FlightDelayModel class # Define column mapping for data analysis self.column_mapping = ColumnMapping() self.column_mapping.target = self.target self.column_mapping.prediction = 'prediction' self.column_mapping.numerical_features = self.numerical_features # Model performance report def performance_report(self, reference_data: pd.DataFrame, current_data: pd.DataFrame): """ Generates a performance report for the model predictions. Args: reference_data (pd.DataFrame): Reference dataset for comparison. current_data (pd.DataFrame): Current dataset with predictions. Returns: Report: A report containing regression performance metrics. """ regression_performance_report = Report(metrics=[RegressionPreset()]) regression_performance_report.run( reference_data=reference_data, current_data=current_data, column_mapping=self.column_mapping ) return regression_performance_report def target_report(self, reference_data: pd.DataFrame, current_data: pd.DataFrame): """ Generates a report for target drift analysis. Args: reference_data (pd.DataFrame): Reference dataset for comparison. current_data (pd.DataFrame): Current dataset with predictions. Returns: Report: A report containing target drift metrics. """ target_drift_report = Report(metrics=[TargetDriftPreset()]) target_drift_report.run( reference_data=reference_data, current_data=current_data, column_mapping=self.column_mapping ) return target_drift_report def data_drift_report(self, reference_data: pd.DataFrame, current_data: pd.DataFrame): """ Generates a report for data drift analysis. Args: reference_data (pd.DataFrame): Reference dataset for comparison. current_data (pd.DataFrame): Current dataset with predictions. Returns: Report: A report containing data drift metrics. """ data_drift_report = Report(metrics=[DataDriftPreset()]) data_drift_report.run( reference_data=reference_data, current_data=current_data, column_mapping=self.column_mapping ) return data_drift_report def data_quality_report(self, reference_data: pd.DataFrame, current_data: pd.DataFrame): """ Generates a data quality report (note: it may take around 10 minutes). Args: reference_data (pd.DataFrame): Reference dataset for comparison. current_data (pd.DataFrame): Current dataset with predictions. Returns: Report: A report containing data quality metrics. """ st.write("Generating the Data Quality Report will take more time, around 10 minutes, due to its thorough analysis. You can either wait or explore other reports if you're short on time.") data_quality_report = Report(metrics=[DataQualityPreset()]) data_quality_report.run( reference_data=reference_data, current_data=current_data, column_mapping=self.column_mapping ) return data_quality_report
Flight_delay_view.py Code
# Import required libraries
import streamlit as st
import pandas as pd # Define a class for the Flight Delay View
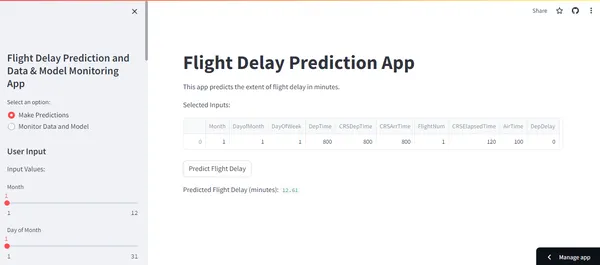
class FlightDelayView: """ The View component for the Flight Delay Prediction App. This class handles the display of the Streamlit web application. """ @staticmethod def display_input_form(): """ Displays the input form on the Streamlit app. """ st.title("Flight Delay Prediction App") st.write("This app predicts the extent of flight delay in minutes.") st.sidebar.header("User Input") @staticmethod def display_monitoring(reference_data, current_data): """ Displays monitoring information. Args: reference_data (DataFrame): Reference dataset. current_data (DataFrame): Current dataset. """ st.write("Please scroll down to see your report") st.write("Reference Dataset Shape:", reference_data.shape) st.write("Current Dataset Shape:", current_data.shape) # Model training information st.write("### Model is training...") @staticmethod def display_selected_inputs(selected_data): """ Displays selected user inputs. Args: selected_data (dict): User-provided input data. """ input_data = pd.DataFrame([selected_data]) st.write("Selected Inputs:") st.write(input_data) return input_data @staticmethod def display_predicted_delay(flight_delay): """ Displays the predicted flight delay. Args: flight_delay (float): Predicted flight delay in minutes. """ st.write("Predicted Flight Delay (minutes):", round(flight_delay[0], 2)) @staticmethod def display_report(report, report_name: str): """ Displays a report generated by Evidently. Args: report (Report): The Evidently report to display. report_name (str): Name of the report (e.g., "Model Performance Report"). """ st.write(f"{report_name}") # Display the Evidently report as HTML with scrolling enabled st.components.v1.html(report.get_html(), height=1000, scrolling=True)
Now, the final Streamlit app arrives, in which we have integrated both prediction and monitoring.
app.py
import streamlit as st
import pandas as pd
from src.controller.flight_delay_controller import FlightDelayController def main(): st.set_page_config(page_title="Flight Delay Prediction App", layout="wide") # Initialize the controller controller = FlightDelayController() # Create the Streamlit app st.sidebar.title("Flight Delay Prediction and Data & Model Monitoring App") choice = st.sidebar.radio("Select an option:", ("Make Predictions", "Monitor Data and Model")) if choice == "Make Predictions": controller.run_prediction() elif choice == "Monitor Data and Model": controller.run_monitoring() if __name__ == '__main__': main()
To run the Streamlit application, execute
#To run the application, execute the following: streamlit run app.pyVisit http://localhost:8501 in your web browser to use the app.
Prediction Dashboard:
Monitoring Dashboard:
Unlocking Insights with Evidently Reports
Data Drift Report:
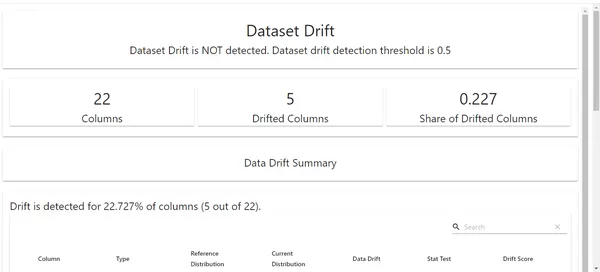
Here, we can see the data drift report for our project. We can see that 5 columns are drifted here. So, our next step would be to analyze the potential reasons behind the drift of these features with the respective domain experts.
Target Drift:
Here, we can see the target drift; no drift is detected here.
Model Performance Report
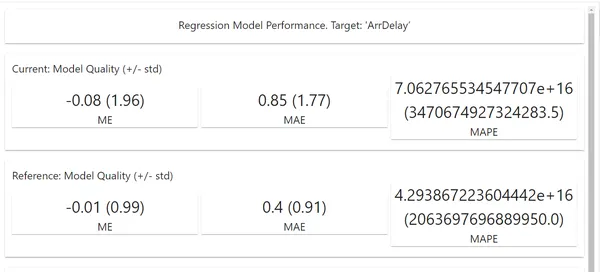
Here, we can see all our model’s performance metrics after analyzing the new batch dataset. We can make the required decisions based on the metrics.
Data Quality Report
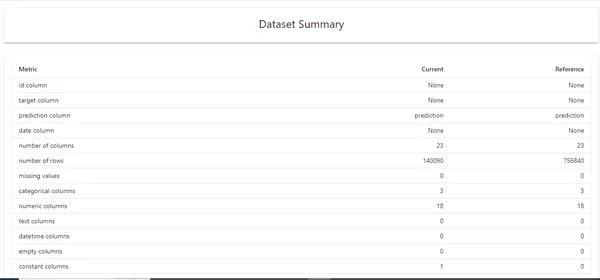
Generally, we use Data quality reports for raw and unprocessed data. We can see all the data-related metrics, like the number of columns, correlation, duplicate values, etc. We can also implement this for doing exploratory data analysis.
Docker Integration for Deployment:
Understanding Docker and Its Significance:
It is important to dockerise our project to run on any environment without any dependency issues. Docker is an essential tool for packaging and distributing applications. Here are the steps to set up and use Docker for this project.
Dockerfile:
The Dockerfile in our project directory contains the instructions for building a Docker image. Write the Dockerfile with the correct syntax.
Project Structure Docker file:
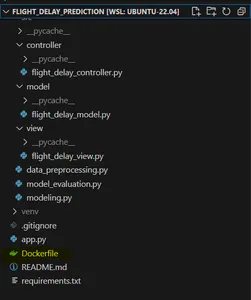
Writing an Efficient Dockerfile
It is essential to have the docker image size as minimal as possible. We can use techniques like multi-staging in docker to reduce the image size and use a very light base image for Python.
Code:
# Use an official Python runtime as a parent image
FROM python:3.9-slim # Set the working directory to /app
WORKDIR /app # Create the necessary directories
RUN mkdir -p /app/data /app/models /app/src/controller /app/src/model /app/src/view # Copy the files from your host machine into the container
COPY app.py /app/
COPY src/controller/flight_delay_controller.py /app/src/controller/
COPY src/model/flight_delay_model.py /app/src/model/
COPY src/view/flight_delay_view.py /app/src/view/
COPY requirements.txt /app/ # Create and activate a virtual environment
RUN python -m venv venv
RUN /bin/bash -c "source venv/bin/activate" # Install any needed packages specified in requirements.txt
RUN pip install -r requirements.txt # Install wget
RUN apt-get update && apt-get install -y wget # Download the dataset file using wget
RUN wget -O /app/data/DelayedFlights.csv https://flightdelay.blob.core.windows.net/flight-delayed-dataset/DelayedFlights.csv # Download the best model file using wget
RUN wget -O /app/models/best_model.pkl https://flightdelay.blob.core.windows.net/flight-delayed-dataset/best_model.pkl # Make port 8501 available to the world outside this container
EXPOSE 8501 # Define the default command to run your Streamlit application
CMD ["streamlit", "run", "app.py"]
Building and Running Docker Containers
Follow these steps to build the Docker image and run a container in the terminal after writing the Dockerfile.
docker build -t flight-delay-prediction .
docker run -p 8501:8501 flight-delay-prediction
Sharing our Streamlit App with Streamlit Sharing:
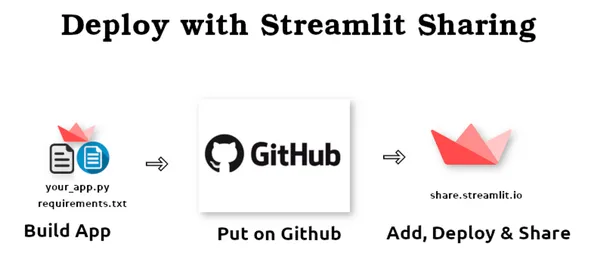
After building our Streamlit application to share with others, we can use Streamlit Sharing to host our applications for free. Here are the below steps to be followed:
1) Organise the project: Ensure having an app.py in the root directory.
2) Define Dependencies: Create a requirements.txt file so that Streamlit sharing installs all the necessary packages mentioned in this file.
3) Use GitHub: Push the repo in GitHub to integrate seamlessly with Streamlit sharing.
Then, sign up in Streamlit sharing, paste your GitHub repo url, and click “deploy”, now your project URL will be generated. You can share it with others.
Conclusion
This guide taught us how to integrate tools like Streamlit, Azure, Docker, and Evidently to build amazing data-driven applications. As we conclude this guide, you will have enough knowledge to build web applications with Streamlit, portable applications through Docker, and ensure the quality of data and the model through Evidently. However, this guide is about reading and applying this knowledge in your upcoming data science projects. Try to experiment, innovate, and explore further enhancements that can be done. Thank you for joining with me till the end of the guide. Keep Learning, Keep doing, and Keep Growing!
Key Takeaways
- It is essential to dockerize our ML project so that it can run in any environment without any dependency issues.
- To reduce the docker image size, consider using multi-staging.
- Implementing MVC architecture in code reduces complexity and enhances code readability for complex web apps.
- Integrating helps us to monitor the data and model quality in the production environment.
- After analyzing all the data and model reports, appropriate actions must be taken.
Frequently Asked Questions
A. No, if we didn’t use MVC architecture here, the Streamlit app code would be more complex, and it would be more difficult for the author to debug the code and other people to understand the code.
A. Yes, it is free, but the resource limit is 1GB.
A. Dockerizing our project enables it to run on any system without compatibility issues.
A. There are no strict rules for selecting reports at any stage, but using the Data quality report for raw, unprocessed data is generally recommended.
A. No, if we find model drift, we need not re-train the model immediately. Retraining the model should be our last option. We should check data quality and data drift reports first.
Related
- SEO Powered Content & PR Distribution. Get Amplified Today.
- PlatoData.Network Vertical Generative Ai. Empower Yourself. Access Here.
- PlatoAiStream. Web3 Intelligence. Knowledge Amplified. Access Here.
- PlatoESG. Carbon, CleanTech, Energy, Environment, Solar, Waste Management. Access Here.
- PlatoHealth. Biotech and Clinical Trials Intelligence. Access Here.
- Source: https://www.analyticsvidhya.com/blog/2023/11/monitor-data-model-in-airline-ops-with-evidently-streamlit-in-production/
- :is
- :not
- :where
- $UP
- 1
- 10
- 11
- 12
- 16
- 30
- 32
- 7
- 9
- a
- About
- Absolute
- accessible
- actions
- acts
- add
- Additional
- addressing
- adjust
- advised
- After
- AI
- airline
- airtime
- Alerts
- All
- allow
- allows
- Alpha
- already
- also
- Although
- always
- amazing
- an
- analysis
- analyze
- analyzing
- and
- any
- app
- Application
- applications
- Applying
- approach
- appropriate
- apps
- architecture
- ARE
- around
- Arrives
- article
- AS
- asked
- At
- author
- available
- Azure
- base
- based
- BE
- before
- behind
- being
- below
- Benchmark
- BEST
- between
- both
- boxes
- BRIDGE
- Broken
- browser
- build
- Building
- but
- button
- by
- calculate
- CAN
- cautious
- chain
- challenge
- chances
- Changes
- check
- choice
- Choose
- choosing
- chosen
- class
- clean
- Cleaning
- click
- Cloud
- code
- Coding
- collect
- Column
- Columns
- comes
- Common
- comparison
- compatibility
- complete
- Completed
- complex
- complexity
- component
- components
- concept
- conclude
- Consider
- consideration
- considerations
- Container
- contains
- controller
- convert
- Core
- correct
- Correlation
- cover
- create
- Creating
- crucial
- Current
- customizable
- customized
- dashboard
- data
- data analysis
- data processing
- data quality
- data science
- data-driven
- datasets
- Date
- day
- decision
- decisions
- Default
- define
- defining
- delay
- delays
- dependencies
- Dependency
- depends
- deployment
- description
- Design
- detected
- DICT
- difference
- different
- difficult
- directories
- Display
- displays
- distributing
- do
- Docker
- doing
- domain
- done
- down
- download
- due
- during
- e
- each
- easy
- efficient
- either
- elements
- empty
- enabled
- enables
- encoding
- end
- enhance
- enhancements
- Enhances
- enough
- ensure
- Environment
- error
- essential
- etc
- Ether (ETH)
- evaluate
- evaluation
- example
- Except
- exception
- execute
- experienced
- experiment
- experiments
- experts
- Exploratory Data Analysis
- explore
- extent
- external
- faced
- factors
- fantastic
- Feature
- Features
- Fetched
- Figure
- File
- Files
- filter
- final
- Find
- First
- flight
- Float
- followed
- following
- For
- forest
- form
- formats
- Free
- from
- frustration
- function
- functioning
- further
- future
- generally
- generate
- generated
- generates
- generating
- generation
- get
- Git
- GitHub
- Go
- good
- gradual
- guide
- Handles
- happens
- Have
- having
- helps
- here
- host
- How
- How To
- However
- HTML
- http
- HTTPS
- idea
- if
- image
- immediately
- implement
- implemented
- import
- importance
- important
- importing
- in
- Including
- influence
- influencing
- information
- Infrastructure
- innovate
- input
- inputs
- insights
- install
- instance
- instances
- instructions
- integrate
- integrated
- Integrating
- integration
- integrity
- interaction
- interactions
- interacts
- Interface
- Intermediate
- into
- Introduction
- issue
- issues
- IT
- ITS
- joining
- journey
- json
- Keep
- Key
- knowledge
- Last
- later
- LEARN
- learning
- let
- libraries
- License
- light
- like
- LIMIT
- LINK
- Listed
- live
- load
- loading
- located
- logic
- machine
- machine learning
- make
- many
- mapping
- May..
- me
- mean
- measure
- mentioned
- method
- metric
- Metrics
- might
- minimal
- minutes
- missing
- ML
- model
- modeling
- models
- Modules
- Monitor
- monitoring
- Month
- more
- multiple
- must
- name
- Natural
- necessary
- Need
- needed
- needs
- New
- next
- no
- note
- now
- number
- numerical
- numpy
- object
- occurred
- of
- official
- often
- on
- ONE
- ones
- open source
- Optimizes
- Option
- or
- Origin
- Other
- Others
- our
- out
- output
- outside
- overall
- packages
- packaging
- pandas
- Pandemics
- part
- parts
- path
- Pattern
- People
- per
- performance
- performing
- phase
- pipeline
- plato
- Plato Data Intelligence
- PlatoData
- Play
- please
- Point
- portable
- possible
- potential
- predict
- predicted
- predicting
- prediction
- Predictions
- Predicts
- preferred
- previous
- proceed
- processing
- Production
- project
- projects
- proper
- provide
- provided
- publicly
- published
- purposes
- Python
- quality
- r2
- raise
- random
- range
- Raw
- RE
- Reading
- reasons
- recommended
- reduce
- reduces
- reference
- regression
- remarkable
- remove
- Removed
- removing
- repeat
- report
- Reports
- representation
- represents
- requests
- required
- Requirements
- resource
- respective
- responsible
- result
- Results
- retraining
- return
- returns
- root
- rules
- Run
- running
- runtime
- s
- same
- SAS
- Save
- saved
- saving
- Science
- score
- script
- scroll
- scrolling
- seamlessly
- seconds
- Section
- see
- select
- selected
- selecting
- SELF
- set
- Sets
- setting
- Shape
- Share
- sharing
- Short
- should
- show
- shown
- sign
- significance
- significant
- since
- situations
- Size
- skew
- slider
- Snippet
- So
- solution
- some
- Source
- specific
- specified
- split
- Squared
- st
- Stage
- stages
- start
- started
- stats
- Step
- Steps
- storage
- store
- streamline
- strict
- structure
- submit
- such
- syntax
- system
- Take
- taken
- taking
- Target
- taught
- techniques
- template
- Terminal
- test
- Testing
- thank
- that
- The
- The Source
- the world
- their
- Them
- then
- There.
- These
- Third
- this
- those
- threshold
- Through
- till
- time
- Title
- to
- token
- tool
- tools
- Train
- trained
- Training
- Transformation
- transforms
- try
- two
- understand
- Unexpected
- unknown
- UNNAMED
- unnecessary
- unwanted
- upcoming
- Update
- URL
- us
- Usage
- use
- used
- User
- User Interface
- users
- using
- usually
- v1
- value
- Values
- variable
- various
- very
- View
- Virtual
- visual
- wait
- want
- was
- we
- web
- Web application
- web applications
- web browser
- webp
- What
- What is
- when
- which
- wide
- will
- windows
- with
- within
- without
- working
- world
- worse
- would
- write
- writing
- written
- Wrong
- X
- XGBoost
- year
- yes
- you
- Your
- zephyrnet