TL; DR Breakdown
- Yesterday Nano was trading in bearish momentum.
- In the early trading hours on the 24- h0urs price chart, the market traded in a bullish momentum with higher volatility.
- The MACD line has crossed over the red signal line implying the coin is experiencing bull pressure.
Nano price analysis: General price overview
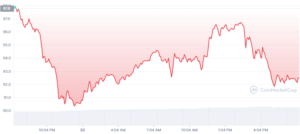
Yesterday Nano was trading in bearish momentum. However, towards the closure of yesterday’s price analysis chart, bulls took control of the market, sending the prices higher in rising wedge trends. The bullish momentum extended to today’s Nano price analysis chart. The positive price trend lasted only thirty minutes on today’s price analysis chart making the coin’s price drop sharply. The buyers could not watch while the markets trade in a negative trend, so they gathered in large numbers, creating a pool of energy that stopped the bearish trend after forming support at $7.1. Since then, the market traded moderately as the number of buyers and sellers almost equalled.
In the early trading hours, The Bollinger indicators showed that the market was trading in bullish momentum with higher volatility. During the day, the Bollinger bands are narrow, indicating that fewer activities are going on in the market.

Source: Coin360
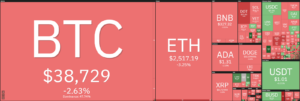
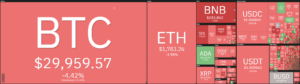
Most parts of the cryptocurrency heat map are green, meaning most coins trade in a bullish trend. The largest digital asset, Bitcoin, is trading at $52.0 with a 2 percent increment from yesterday’s price, while Ethereum is trading slightly below $4K. Cardano is trading in a negative trend having a decline of more than 2 percent. The Binance coin trades with a few dollars below $500. NANO/USD has recorded a 3.47 percent surge, and it is currently trading at $7.3.
NANO/USD price movement in the last 24 hours: Nano trades in a tight range
The Bollinger bands are generally narrow on the 24-hours Nano price analysis chart. This is because the NANO/USD pair traded in a tight range of $7.0-7.6.
At the time of writing, NANO/USD is trading at $7.29 with a 24-hour trading volume of $63,498,399, an increase of 2.98 percent.
The 50-day Moving Average has crossed over the 100- day moving average; this is a bullish signal. There is a possibility of NANO/USD starting a bullish trend in the next 24 hours.
NANO/USD four-hour price analysis chart: bullish signal
On the four-hour price analysis chart, the green candlesticks seem to be outdoing the red ones suggesting the market is slightly bullish on the four-hour price analysis chart.

Source: Tradingview
The Balance of Power PoB indicator is almost at 1, meaning the bull preasure has overwhelmed the sellers’ pressure. The bulls are likely to trigger a further price surge if bears will not battle the trend and create a strong resistance.
Nano price analysis general price overview
The MACD line has crossed the red signal line, and the MACD histogram’s green bars have outnumbered the red bars, suggesting that the market is now in the hands of bulls. Traders should begin trading as soon as possible before prices rise much more. Traders should start trading as soon as possible before prices rise significantly higher.
Disclaimer. The information provided is not trading advice. Cryptopolitan.com holds no liability for any investments made based on the information provided on this page. We strongly recommend independent research and/or consultation with a qualified professional before making any investment decisions.
Source: https://api.follow.it/track-rss-story-click/v3/tHfgumto13C6s9l0mJdq9UTXPGaG87AR
- 98
- activities
- advice
- analysis
- asset
- bars
- Battle
- bearish
- Bearish Momentum
- Bears
- binance
- Bullish
- Bulls
- closure
- Coin
- Coins
- Creating
- cryptocurrency
- Cryptopolitan
- data
- day
- digital
- Digital Asset
- dollars
- Drop
- Early
- energy
- General
- Green
- HTTPS
- Increase
- information
- investment
- Investments
- IT
- large
- liability
- Line
- MACD
- Making
- map
- Market
- Markets
- Momentum
- nano
- numbers
- pool
- power
- pressure
- price
- Price Analysis
- price surge
- range
- research
- Sellers
- So
- start
- support
- surge
- time
- trade
- Traders
- trades
- Trading
- Trends
- Volatility
- volume
- Watch
- writing