Or further to go?
It’s been a shaky start to the new year, with interest rate anxieties dragging on sentiment and hitting the NAS100 particularly hard.
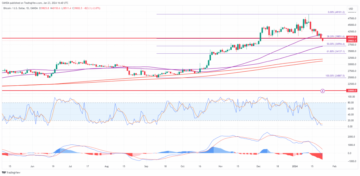
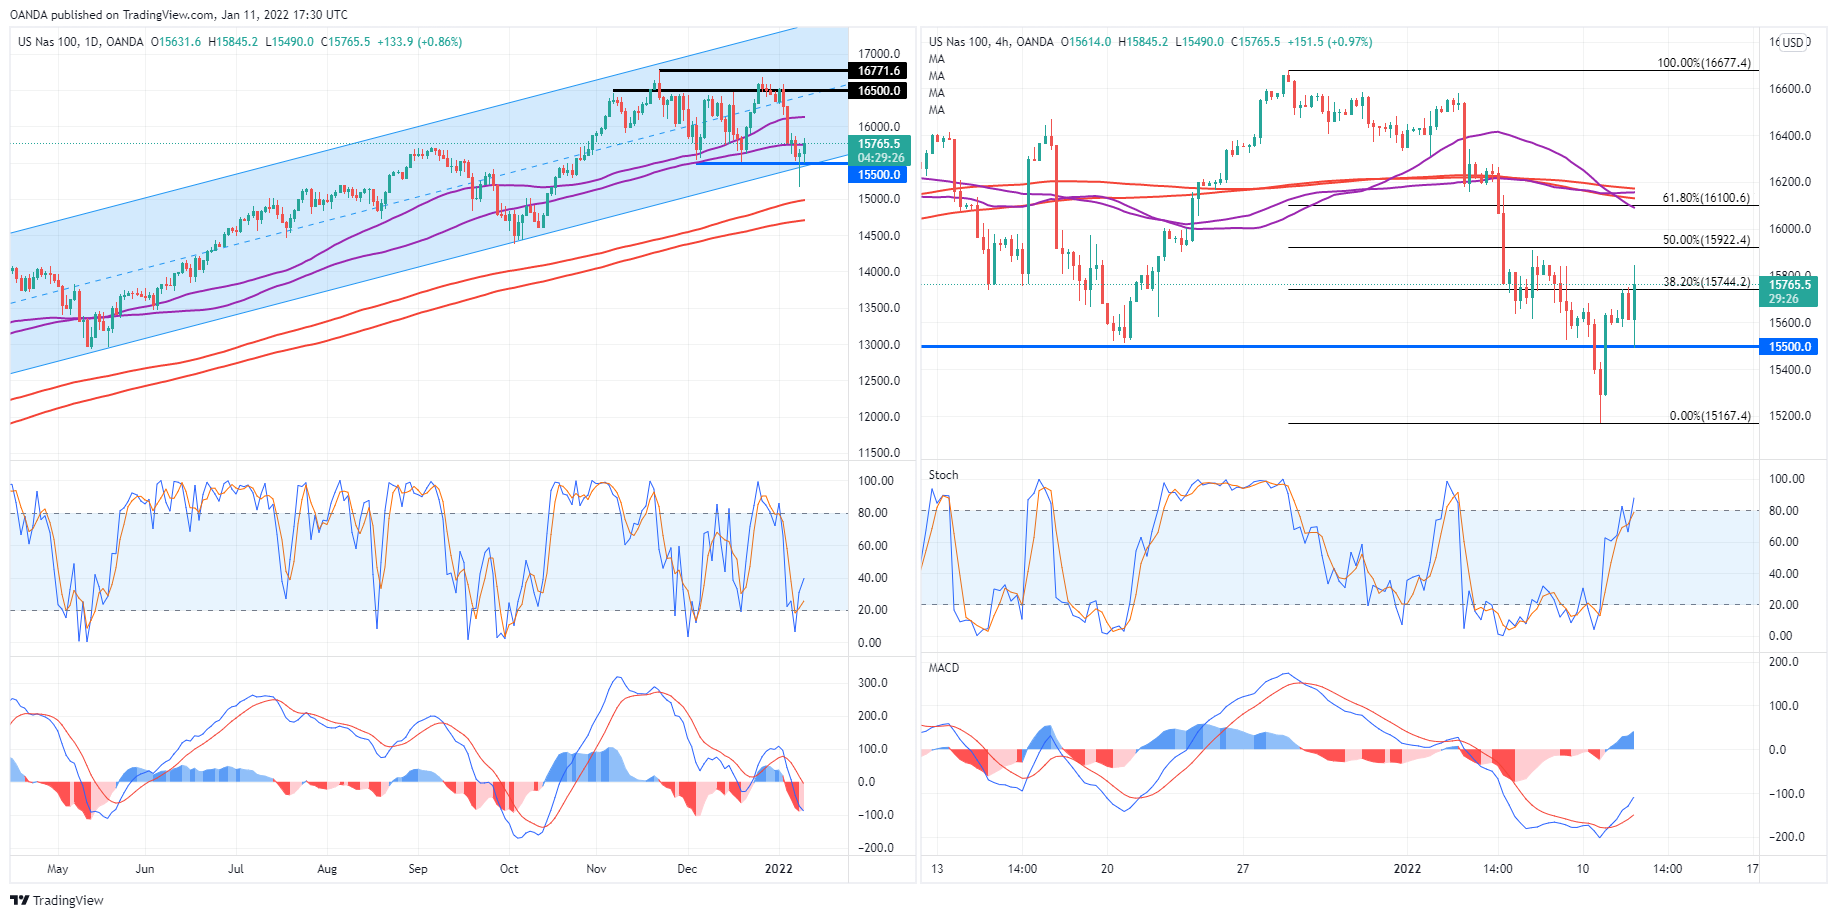
The index fell more than 8% over the last week, breaking through key support in the process which could have led to a much deeper correction. Instead, the index bounced strongly in the final hours of trading on Monday and failed to close below the rising channel.
While a deeper correction could still be on the cards, the false breakout – as it now appears to have been – could signal the end of the panic in tech stocks.
If the index can overcome a few key tests above – potentially aided by earnings season which is about to get underway – it could continue the trend we’ve seen since the lows of March 2020.
The first test is around 15,900-15,922, where prior resistance combines with the 50% Fibonacci retracement level. Above here, around 16,100-16,150 will be interesting, combining the 50/89-day SMA band, with the 61.8 fib and the 55/89 and 200/233-period SMA bands on the 4-hour chart.
A move above here could see the NAS100 gather pace to the upside.
Source: https://www.marketpulse.com/20220111/nas100-correction-complete/