- A 16% rally seen in Nvidia (ex-post earnings) has led the Nasdaq 100 to recoup its entire loss of -3.5% from last Friday, 16 February high to Wednesday, 21 February low.
- The current positive momentum and trend conditions of Nvidia may assert a further positive feedback loop back into the Nasdaq 100.
- Watch the key pivotal support at 17,650 with the next intermediate resistance at 18,220/270 for Nasdaq 100.
This is a follow-up analysis of our prior report, “Nasdaq 100 Technical: Torpedoed by Nvidia, at risk of undergoing multi-week corrective decline” published on 21 February 2024. Click here for a recap.
What a roller coaster and wild ride it has been for the Nasdaq 100 which threaded on an initial minor corrective decline trajectory of -3.5% from its last Friday, 16 February high to this Wednesday, 21 February low.
Since the publication of our prior analysis, the price actions of the US Nas 100 Index (a proxy for the Nasdaq 100 futures) have indeed shaped a further pushdown and met the first intermediate support of 17,350 (printed an intraday low of 17,324 during late US session on Wednesday, 21 February).
Thereafter within four hours, the Index rallied by +1.8% and pushed higher yesterday, 22 February to recoup all the prior losses inflicted from last Friday. In the past two sessions, it has gained by +4.1% from Wednesday, 21 February intraday low of 17,324 to retest its current all-high level of 18,043 of 12 February (printed an intraday high of 18,037 during yesterday’s US session).
The remarkable “V” shaped rally has been attributed to the stunning +16.4% rally seen on the share price of Nvidia (the third biggest market cap component stock of Nasdaq 100) after it posted better than expected Q4 2023 earnings and issued positive guidance on its revenue in the current Q1 2024 quarter of around US$24 billion the surpassed analyst’s expectation of US$21.9 billion on the average.
Given the significant influence on the share price movement of Nvidia towards the US Nas 100 Index which can be traced back to a high positive 20-day correlation coefficient of 0.85 between the two as of yesterday, 22 February. Hence, it will be paramount to analyse the momentum and trend trajectory of Nvidia’s share price movement.
Medium-term and major uptrend phases intact for Nvidia
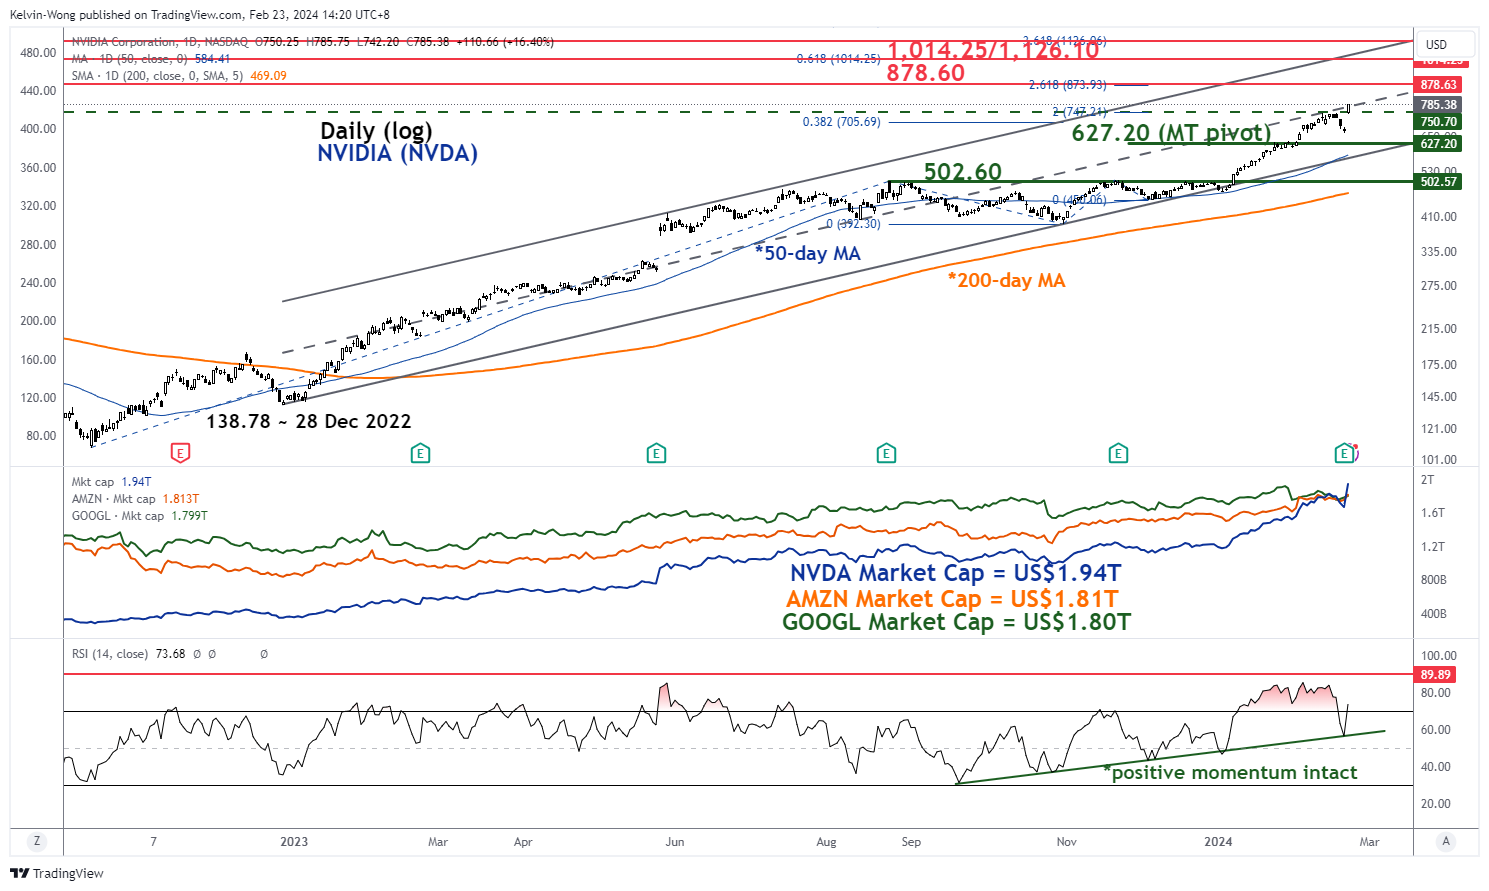
Fig 1: Nvidia medium-term and major trends as of 22 Feb 2024 (Source: TradingView, click to enlarge chart)
The medium-term upside momentum of Nvidia remains intact as depicted by the daily RSI momentum indicator which has been supported by a parallel ascending trendline support since 21 September 2023 and managed to stage a rebound right above the 50 level yesterday.
This positive momentum reading is likely to support the ongoing medium-term uptrend and major uptrend phases in place since the 31 October 2023 low and 28 December 2022 low respectively.
If the 627.20 key medium-term pivotal support holds, its medium-term uptrend phase trajectory remains intact potentially with the next medium-term resistances to watch at 878.60 and 1,014.25/1,126.10).
Nasdaq 100 may see another fresh all-time high
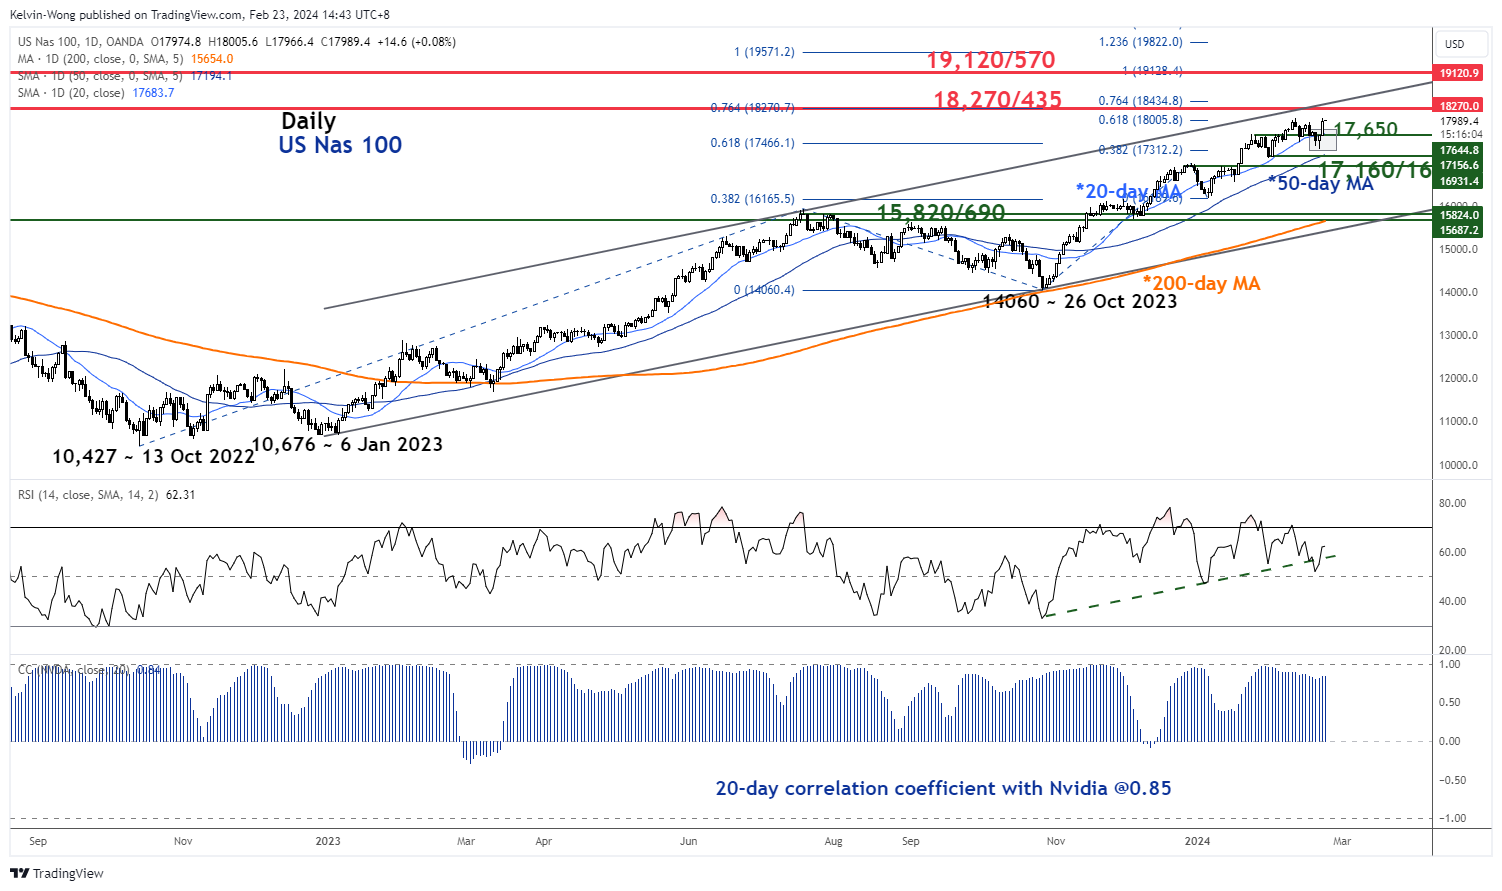
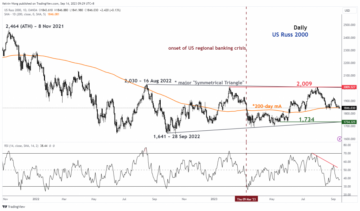
Fig 2: US Nas 100 medium-term & major trends as of 23 Feb 2024 (Source: TradingView, click to enlarge chart)
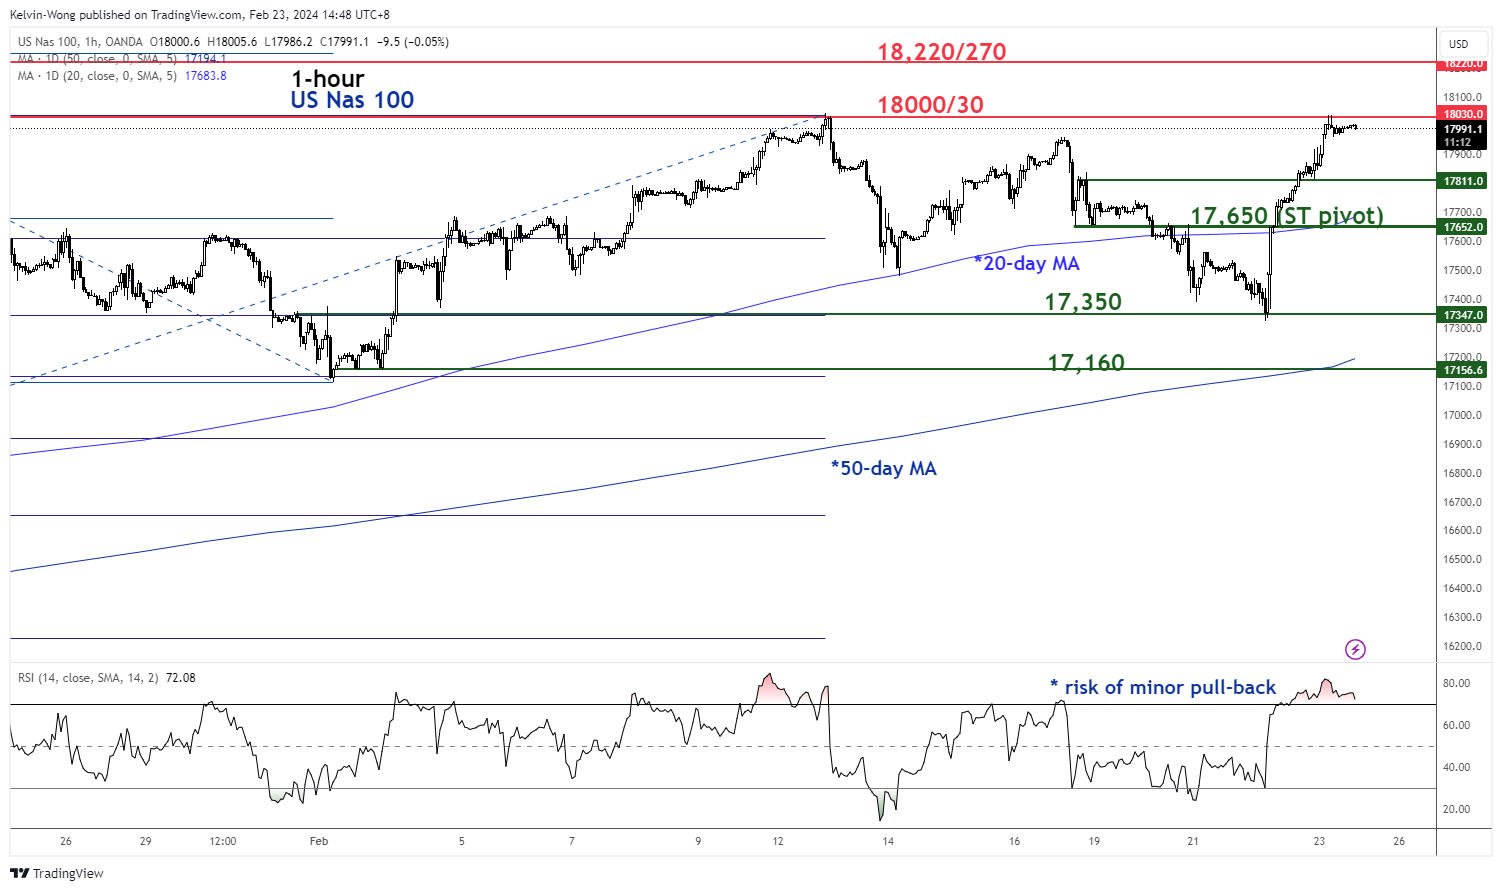
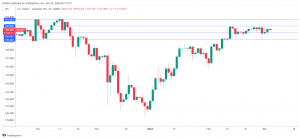
Fig 3: US Nas 100 short-term trend as of 23 Feb 2024 (Source: TradingView, click to enlarge chart)
Yesterday’s “V-shaped” rally in the price actions of the Index and the integration back above its 20-day moving average has increased the odds of a new potential short-term impulsive upmove sequence for its short and medium-term uptrend phases.
Given the current rally has been swift and abrupt that led its hourly RSI momentum indicator to hit a rather extreme overbought level of 81.70 which in turn may see the risk of an imminent minor pull-back below the first intermediate resistance of 18,030 (close to the current all-time high level of 18,043 printed on 12 February).
If the potential minor pull-back manages to hold above the 17,650 short-term pivotal support (20-day moving average & close to the 61.8% Fibonacci retracement of yesterday’s rally from the 21 February low to the 22 February high), the Index may continue its short-term impulsive upmove sequence with the next intermediate resistance to watch at 18,220/270.
However, failure to hold at 17,650 negates the bullish tone to expose the next intermediate supports of 17,350 and 17,160 (also the upward-sloping 50-day moving average).
Content is for general information purposes only. It is not investment advice or a solution to buy or sell securities. Opinions are the authors; not necessarily that of OANDA Business Information & Services, Inc. or any of its affiliates, subsidiaries, officers or directors. If you would like to reproduce or redistribute any of the content found on MarketPulse, an award winning forex, commodities and global indices analysis and news site service produced by OANDA Business Information & Services, Inc., please access the RSS feed or contact us at info@marketpulse.com. Visit https://www.marketpulse.com/ to find out more about the beat of the global markets. © 2023 OANDA Business Information & Services Inc.
Latest posts by Kelvin Wong (see all)
- SEO Powered Content & PR Distribution. Get Amplified Today.
- PlatoData.Network Vertical Generative Ai. Empower Yourself. Access Here.
- PlatoAiStream. Web3 Intelligence. Knowledge Amplified. Access Here.
- PlatoESG. Carbon, CleanTech, Energy, Environment, Solar, Waste Management. Access Here.
- PlatoHealth. Biotech and Clinical Trials Intelligence. Access Here.
- Source: https://www.marketpulse.com/indices/nasdaq-100-technical-bulls-rescued-by-nvidia-again/kwong
- :has
- :is
- :not
- 1
- 10
- 100
- 12
- 15 years
- 15%
- 16
- 160
- 17
- 2%
- 20
- 2022
- 2023
- 2024
- 21
- 22
- 23
- 28
- 31
- 350
- 5
- 50
- 60
- 70
- 700
- 9
- a
- About
- above
- access
- actions
- addition
- advice
- affiliates
- After
- again
- All
- also
- an
- analyse
- analyses
- analysis
- and
- Another
- any
- ARE
- around
- AS
- ascending
- At
- author
- authors
- avatar
- average
- award
- back
- BE
- beat
- been
- below
- Better
- between
- Biggest
- Billion
- Box
- Bullish
- Bulls
- business
- buy
- by
- CAN
- cap
- Chart
- click
- Close
- COM
- combination
- Commodities
- component
- conditions
- conducted
- Connecting
- contact
- content
- continue
- Correlation
- correlation coefficient
- courses
- Current
- daily
- December
- Decline
- depicted
- Directors
- during
- Earnings
- Elliott
- enlarge
- Entire
- Ether (ETH)
- exchange
- expectation
- expected
- experience
- expert
- extreme
- Failure
- Feb
- February
- feedback
- Fibonacci
- financial
- Find
- First
- flow
- For
- foreign
- foreign exchange
- forex
- found
- four
- fresh
- Friday
- from
- fund
- fundamental
- further
- Futures
- gained
- General
- Global
- global markets
- guidance
- Have
- hence
- High
- higher
- Hit
- hold
- holds
- HOURS
- HTTPS
- if
- impulsive
- in
- Inc.
- increased
- indeed
- index
- Indicator
- Indices
- influence
- information
- initial
- integration
- Intermediate
- into
- investment
- Issued
- IT
- ITS
- Kelvin
- Key
- Last
- Late
- Led
- Level
- levels
- like
- likely
- loss
- losses
- Low
- Macro
- major
- managed
- manages
- Market
- Market Cap
- market outlook
- market research
- MarketPulse
- Markets
- max-width
- May..
- met
- minor
- Momentum
- more
- movement
- moving
- moving average
- nas
- Nasdaq
- Nasdaq 100
- necessarily
- New
- news
- next
- numerous
- Nvidia
- october
- Odds
- of
- officers
- on
- ongoing
- only
- Opinions
- or
- our
- out
- Outlook
- over
- Parallel
- Paramount
- passionate
- past
- perspectives
- phase
- phases
- photo
- pivotal
- Place
- plato
- Plato Data Intelligence
- PlatoData
- please
- positioning
- positive
- posted
- Posts
- potential
- potentially
- price
- Prior
- Produced
- providing
- proxy
- Publication
- purposes
- pushed
- Q1
- Quarter
- rally
- rather
- Reading
- rebound
- recap
- remains
- remarkable
- report
- rescued
- research
- Resistance
- retail
- retracement
- revenue
- Reversal
- Ride
- right
- Risk
- rsi
- rss
- Securities
- see
- seen
- sell
- senior
- September
- Sequence
- service
- Services
- session
- sessions
- shaped
- Share
- sharing
- Short
- short-term
- significant
- since
- Singapore
- site
- solution
- Source
- specializing
- Stage
- stock
- Stock markets
- Strategist
- Stunning
- subsidiaries
- support
- Supported
- Supports
- surpassed
- SWIFT
- Technical
- Technical Analysis
- ten
- than
- that
- The
- Third
- this
- thousands
- to
- TONE
- towards
- Traders
- Trading
- TradingView
- Training
- trajectory
- Trend
- Trends
- TURN
- two
- undergoing
- unique
- Upside
- uptrend
- us
- using
- v1
- Visit
- Watch
- Wave
- Wednesday
- WELL
- which
- Wild
- will
- winning
- with
- within
- wong
- would
- years
- yesterday
- you
- zephyrnet