TL;DR Breakdown
- NEAR price analysis indicates that the market is bearish.
- The price is hovering between $9.525 and $8.168.
- Overall, a downtrend can be observed in the market.
- RSI and MACD indicators suggest that the price is all set for a further downslide
- Market might improve once NEAR hits the last support of $7.349
NEAR Price Analysis is quite bearish today, as we can see a decrease in the price from $8.957 yesterday to $8.0127 (the current price). Over the last three days, the coin has remained consistently bearish but that might change soon.

A quick look at the crypto market heat map shows that it is not just NEAR that has bearish tendencies today. Rather, the price of Bitcoin has lowered by 3.83 percent as well.

Some interesting insights can be obtained from our Near price analysis 1-Day chart. First, the projection of the RSI is downwards. Although the curve is not steep, it is currently hitting 60.61 and is linearly heading lower.
Based on this, we can predict that the market might slowly be moving from an overbought state to a more balanced one. If the trend continues, a further decrease in the price is imminent. Furthermore, the MACD analysis also shows an impending crossover, which will shift the market further to the downslide as per NEAR price analysis.
24-Hour NEAR price analysis – Price moves towards support

In the last 24 hours, NEAR price has gone down from $9.525 to the current closing price of $8.168. With that, the current market cap of NEAR is $3570.82Million, based on which its current market rank is 43rd.
While on the 1-day graph we see an overall bearish pattern in the last 24 hours, there are small periods where bulls have overcome the resistance.
Furthermore, RSI indicator shows a consistent improvement in the ongoing hour. The curve is currently touching 41.46, which for now, indicates a decent market balance. Since the projection is upwards and steep, some improvement might be seen in the coming few hours.
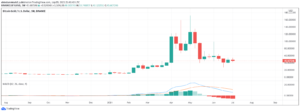
NEAR/USD 4-hour chart: All set for a further downslide

The 4-Hour graph shows a bearish trend in the last 4 hours. A crossover between the curves in the MACD indicator is not happening soon. So, in the hours upcoming, traders should not expect a big shift in the market.
The RSI curve is also somewhat stable but projecting downwards while touching the 42.78 levels currently. These indicators suggest that the market might be all set to move further down in a couple of hours. So, it may not be the best time to make any short-term investments.
NEAR price analysis: Conclusion
Overall, the market today is consistently bearish. NEAR/USD did not experience much volatility in the last 24 hours, and the same is expected for the next day as well.Day traders looking for short-term profits should hold their investments until some improvement in the price can be projected. For now, NEAR seems to be fluctuating between the previous support of $7.349 and the 11 of September’s high of $11.886.
While you wait for the NEAR price to improve, consider reading our crypto wallet guides.
Disclaimer. The information provided is not trading advice. Cryptopolitan.com holds no liability for any investments made based on the information provided on this page. We strongly recommend independent research and/or consultation with a qualified professional before making any investment decisions.
Source: https://api.follow.it/track-rss-story-click/v3/tHfgumto13D2bSSQ41sot2hamfNIiY2W
- 11
- advice
- All
- analysis
- bearish
- BEST
- Bulls
- change
- Coin
- coming
- continues
- Couple
- crypto
- Crypto Market
- Current
- curve
- data
- day
- DID
- experience
- First
- High
- hold
- HTTPS
- impending
- information
- insights
- investment
- Investments
- IT
- liability
- Making
- map
- Market
- Market Cap
- move
- Near
- Pattern
- price
- Price Analysis
- Reading
- research
- set
- shift
- small
- So
- State
- support
- time
- Traders
- Trading
- Volatility
- wait
- Wallet