Our beloved MEME Coins provided a remarkable rally in October, teasing all those non-believers with their expensive gain. Though these coins lose the battle of value investing, they sure are some fast-moving coins that give an easy jackpot to those fortunate ones. These meme coins are currently in a retracement phase, preparing for their next destination.
DOGE/USD Chart In The 4-hour Time Frame

Source- DOGE/USD chart by Tradingview
On October 28th, the DOGE coin price was rejected from the crucial resistance of the $0.34 mark, which resulted in a minor retracement phase. However, it seems the coin has more plans for market bears as its technical chart indicates a descending triangle pattern in the 4-hour time frame chart.
The neckline for this bearish pattern is at the $0.254 mark, providing an excellent sell opportunity for crypto traders if the price provides a decisive breakout from this bottom support.
However, contradicting the price pattern, the Relative Strength Index(58) shows a strong bullish divergence in its chart, suggesting increasing the strength of the market buyers. Thus, it is suggested that the traders should wait for a proper breakout before entering the crypto market with a new position.
SHIB/USD Chart In The 4-hour Time Frame
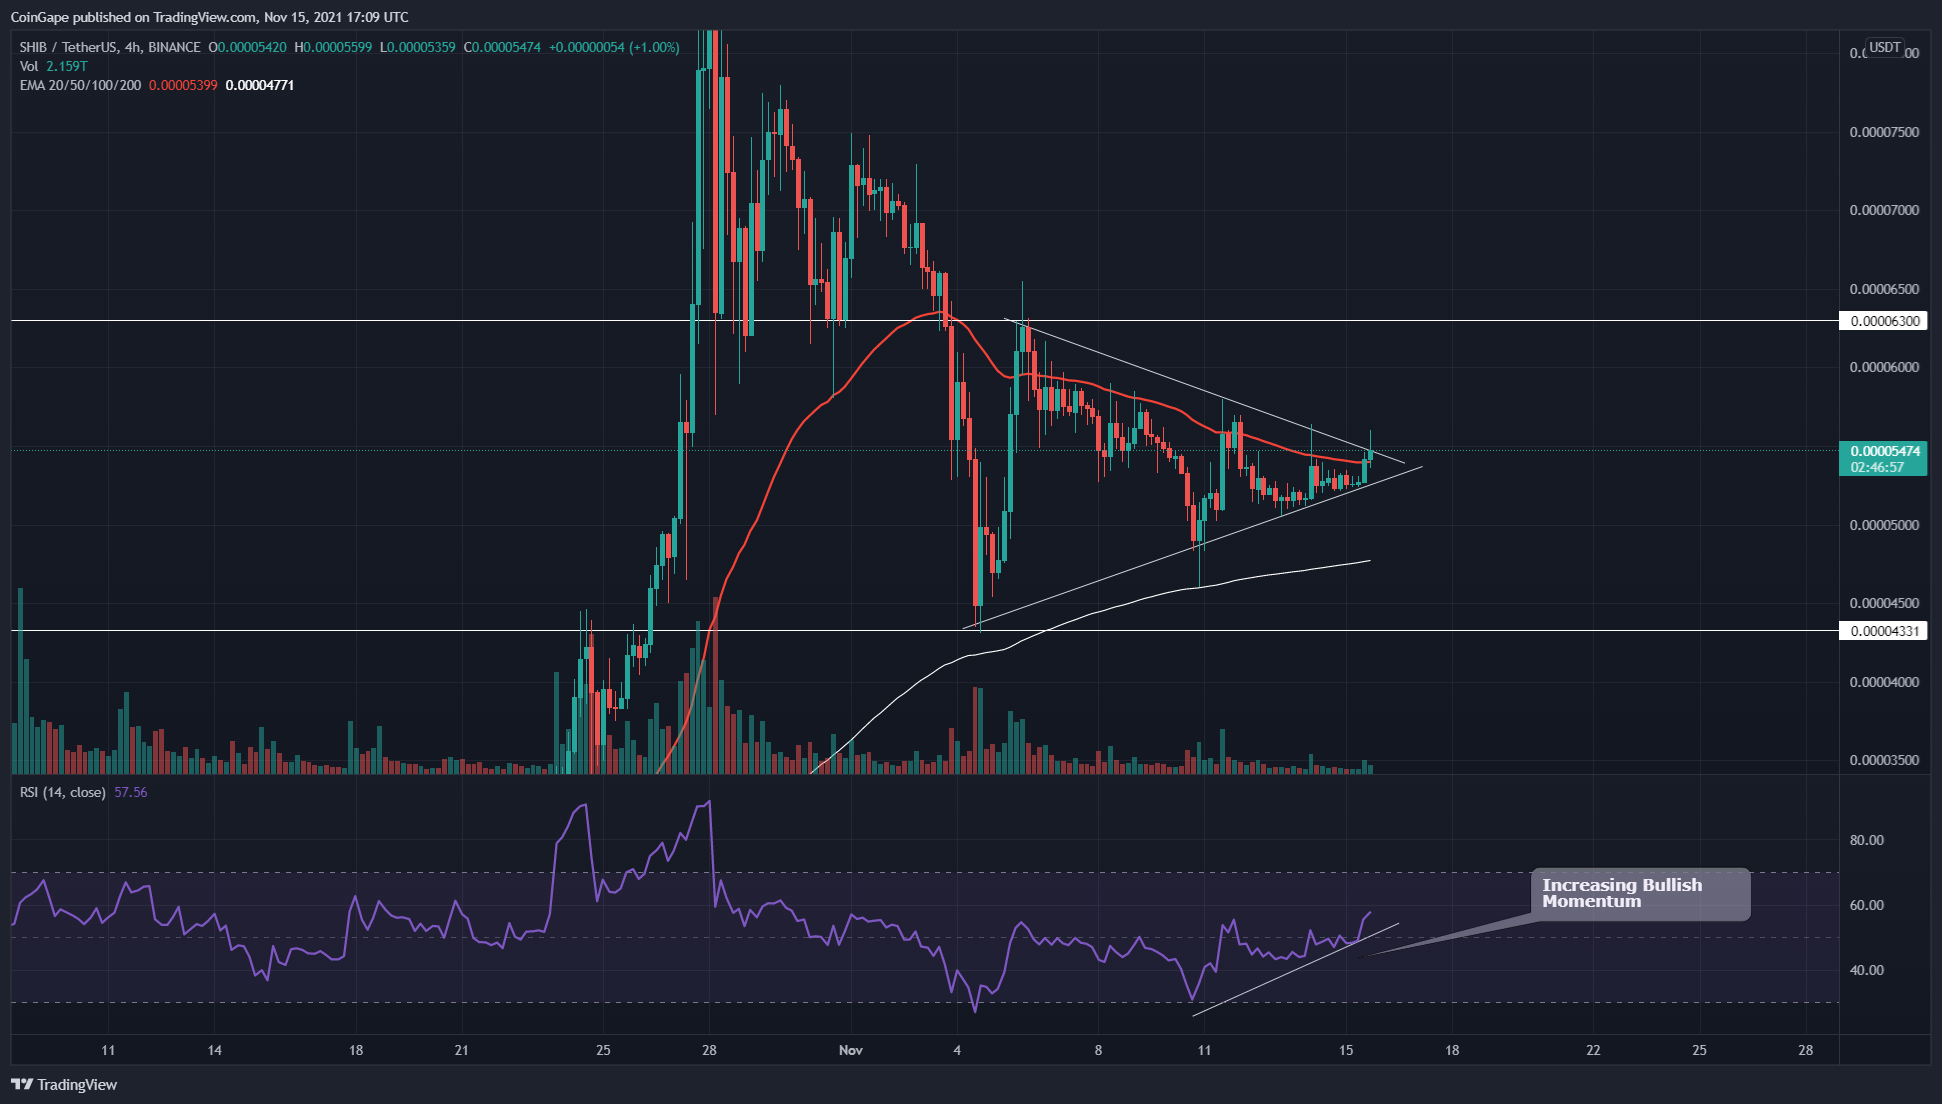
Source- SHIB/USD chart by Tradingview
The SHIB token shows an excellent trading opportunity for crypto traders by forming a symmetrical triangle pattern in the 4-hour time frame chart. The coin price is currently facing strong rejection from the resistance line, indicating a consolidation period will remain intact.
Once the price gives a proper breakout from either side of the trendline, the crypto trader can grab a great entry opportunity with the expectation of a strong directional move. Furthermore, the Relative Strength Index(58) chart showed impressive growth in the RSI value, suggesting a better possibility of a bullish breakout.
FLOKI/USD Chart In The 4-hour Time Frame
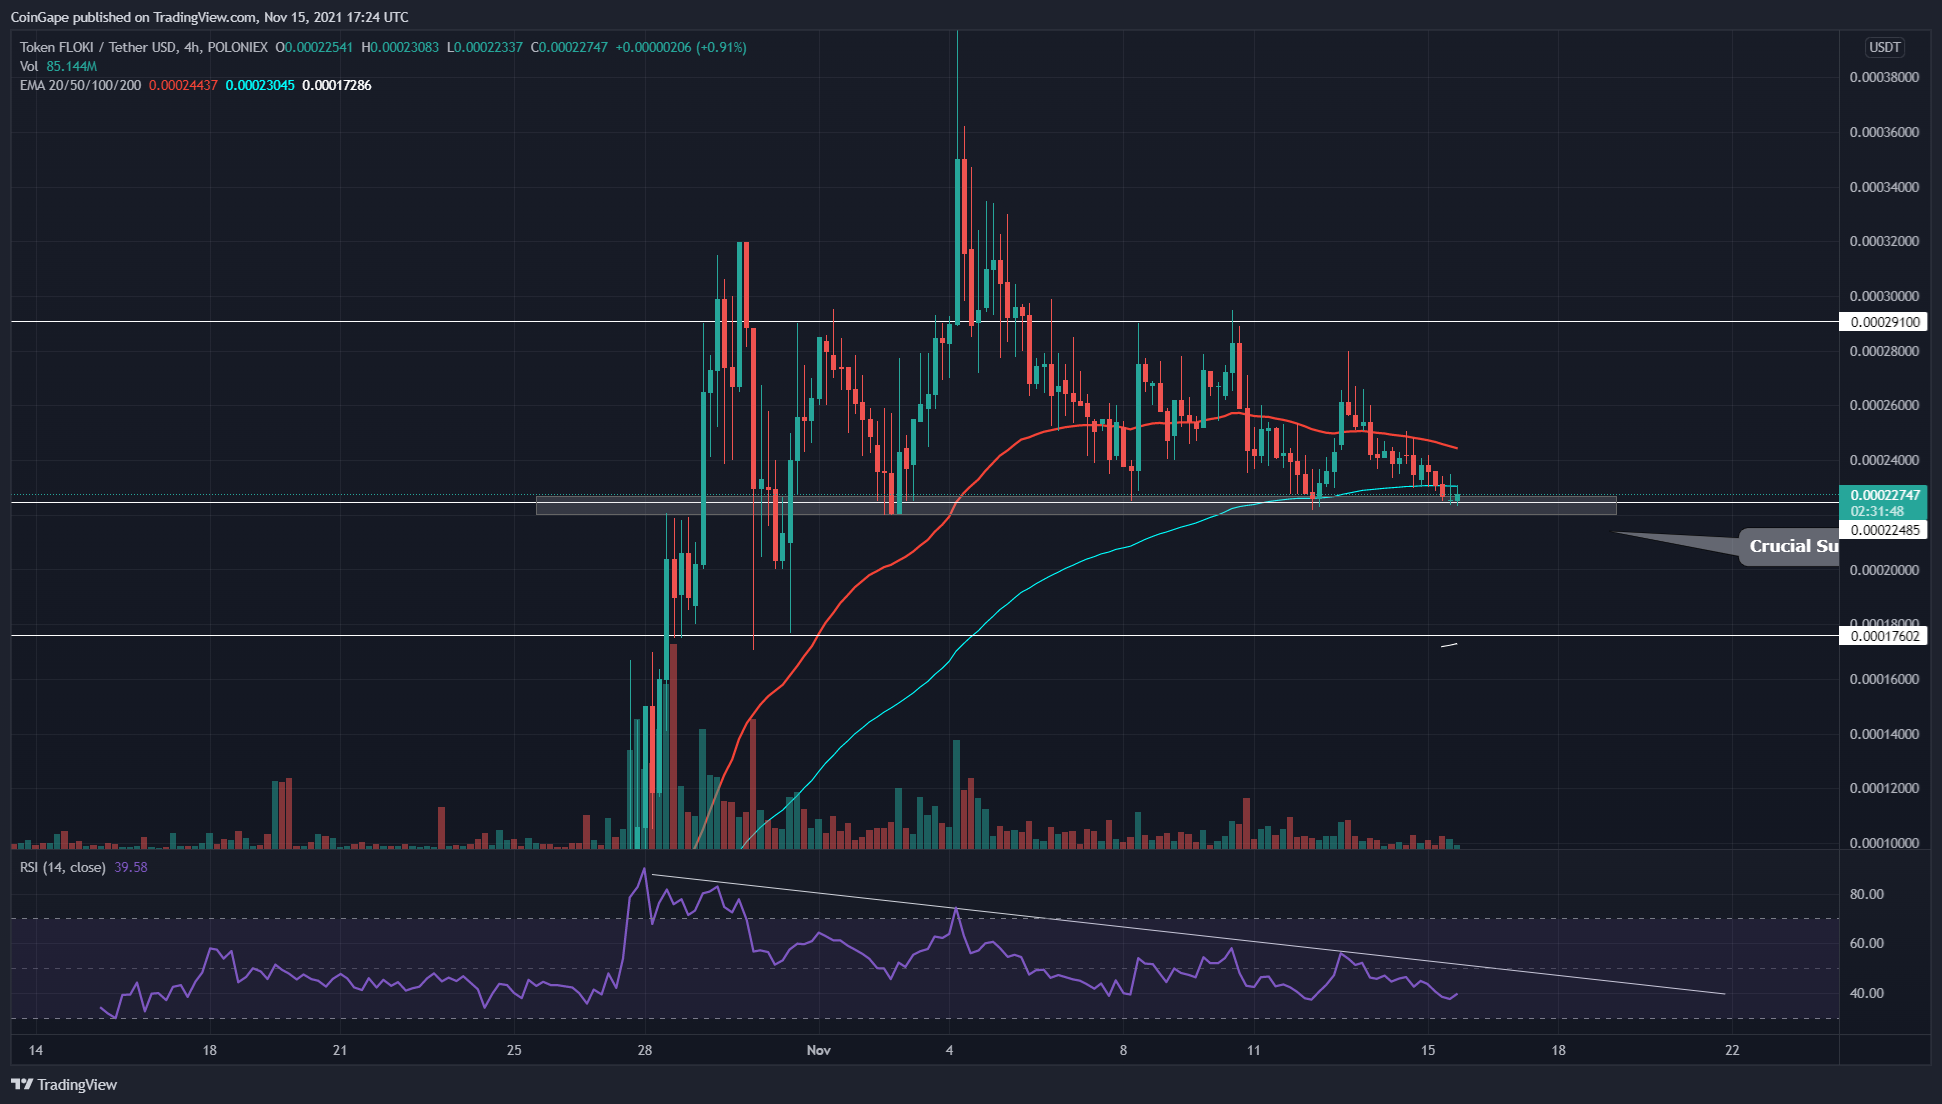
Source- FLOKI/USD chart by Tradingview
The FLOKI technical chart suggests even more fall for this token with a head and shoulder pattern formation in the 4-hour time frame chart. The crucial support(neckline) for this pattern is located at the $0.000244 mark.
If the token provides a proper breakdown from this bottom support, the FLOKI price is likely to drop back to the $0.000176 mark.
The Relative Strength Index(38) is clearly in support of the bears, as its chart shows a steady downtrend aiming for the oversold territory.
Source: https://coingape.com/november-15th-price-analysis-dogecoin-shiba-inu-floki-inu/
- Aiming
- All
- analysis
- Battle
- bearish
- Bears
- breakout
- Bullish
- Coin
- Coins
- consolidation
- content
- crypto
- Crypto Market
- crypto traders
- cryptocurrencies
- Dogecoin
- Drop
- facing
- financial
- grab
- great
- Growth
- head
- hold
- HTTPS
- investing
- IT
- Line
- mark
- Market
- market research
- meme
- move
- Opinion
- Opportunity
- Pattern
- price
- Price Analysis
- rally
- research
- sell
- Share
- support
- Symmetrical Triangle
- Technical
- time
- token
- trader
- Traders
- Trading
- value
- wait