- 3 key risk events that may significantly influence the movement of NZD/JPY; Japan’s FY 2024/2025 annual wage negotiations preliminary results (15 March), BoJ’s monetary policy outcome (19 March) & Fed FOMC and release of its latest dot plot (20 March).
- Technical analysis has indicated a potential medium-term bearish momentum on sight for NZD/JPY.
- Watch the key short-term resistance of 92.00 for NZD/JPY.
This is a follow-up analysis of our prior report, “NZD/JPY: JPY crosses under downside pressure after BoJ’s hawkish guidance” published on 24 January 2024. Click here for a recap.
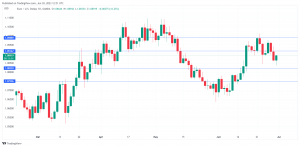
The NZD/JPY cross pair has drifted lower after our prior analysis and hit the first intermediate support level of 89.40 (printed an intraday low of 89.26 on 1 February) before it reversed up to print a 52-week high of 93.45 on 23 February.
Right now, technical elements on both medium and short-term horizons are still flashing bearish biases to advocate for another round of further potential weakness in NZD/JPY.
3 key event risks ahead (Japan’s annual wage negotiations results, BoJ & FOMC)
The next key risk events to watch out for that may influence this JPY cross-pair significantly will be the outcome of the Bank of Japan’s (BoJ) monetary policy decision on 19 March, and on 15 March, Rengo, Japan’s biggest labour union federation releases the first results of the FY 2024/2025 annual wage negotiations where the expectations have been set for an average annual increase of 3.85% (slightly above last year’s 3.58%) for Japanese employees, the highest wage increase in 31 years if it materializes.
BoJ Governor Ueda has highlighted numerous times in public that BoJ will focus on the outcome of the wage negotiations which has an impact on sustainable demand-pull inflationary trends in Japan and, in turn, plays a significant part in setting up the decision to end short-term negative interest rates policy in April where most of the consensus has pencilled in.
Next up on the calendar will be the US Federal Reserve FOMC monetary policy outcome, and the release of its latest “dot plot” on 20 March (market participants are likely to pay attention to the new projected US inflationary trends, and Fed funds rate forecasts).
Failure bullish breakout on NZD/JPY
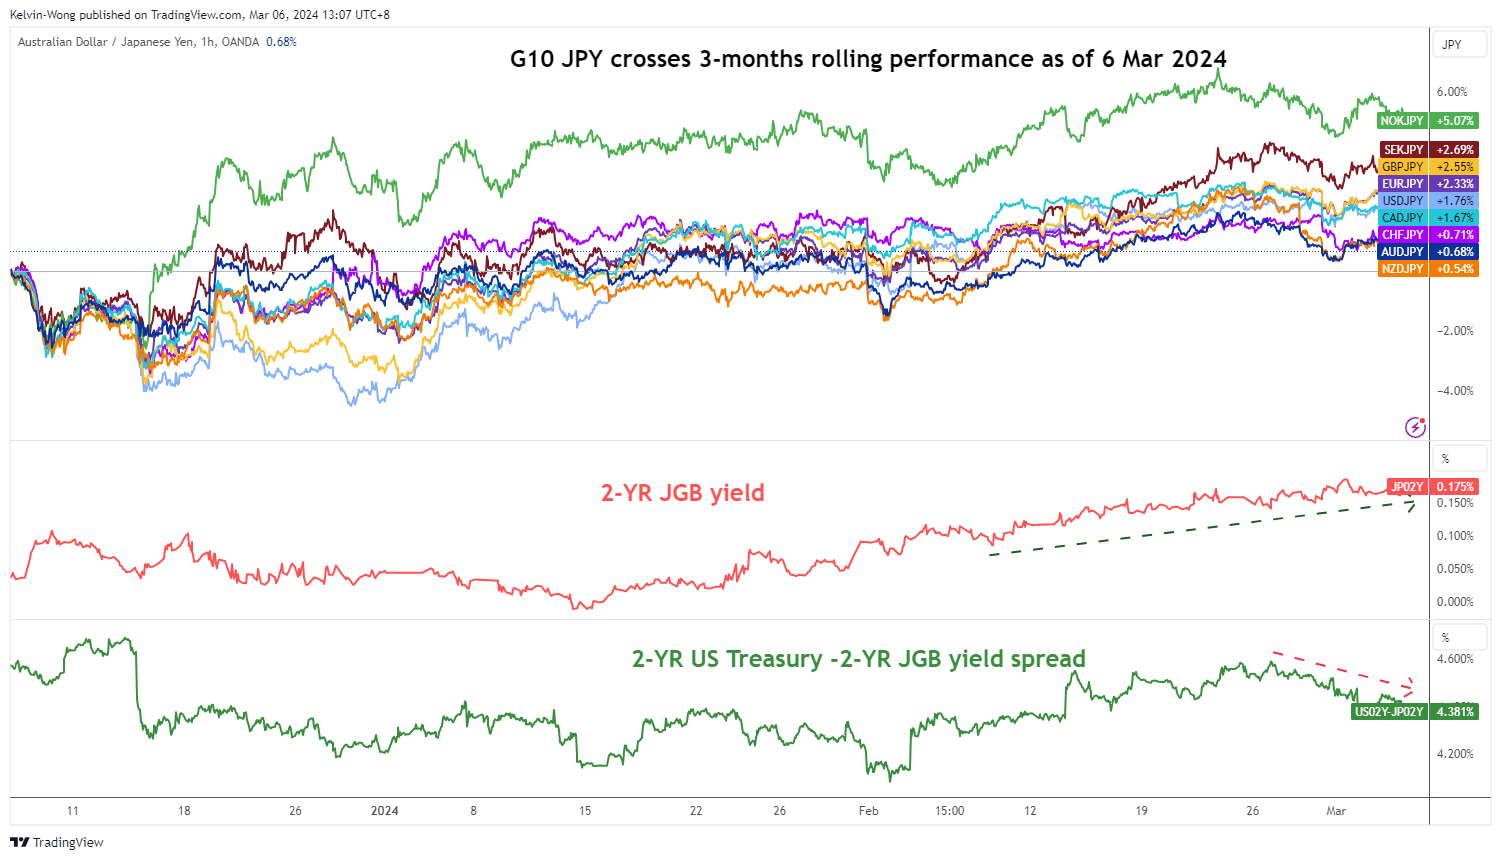
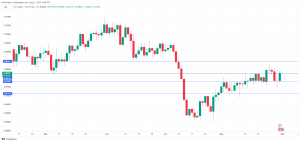
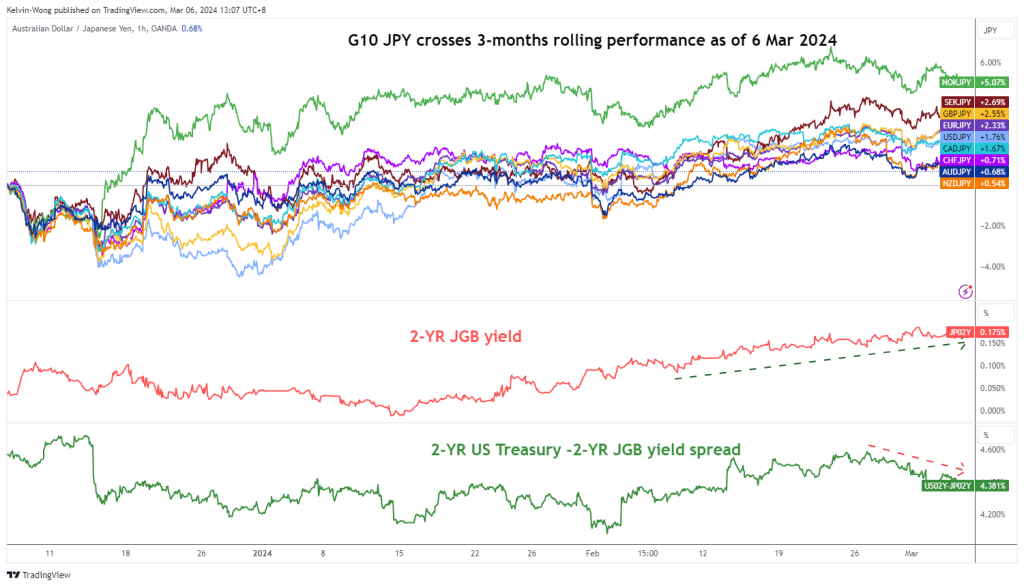
Fig 1: 3-month rolling performances of G-10 JPY crosses as of 6 Mar 2024 (Source: TradingView, click to enlarge chart)
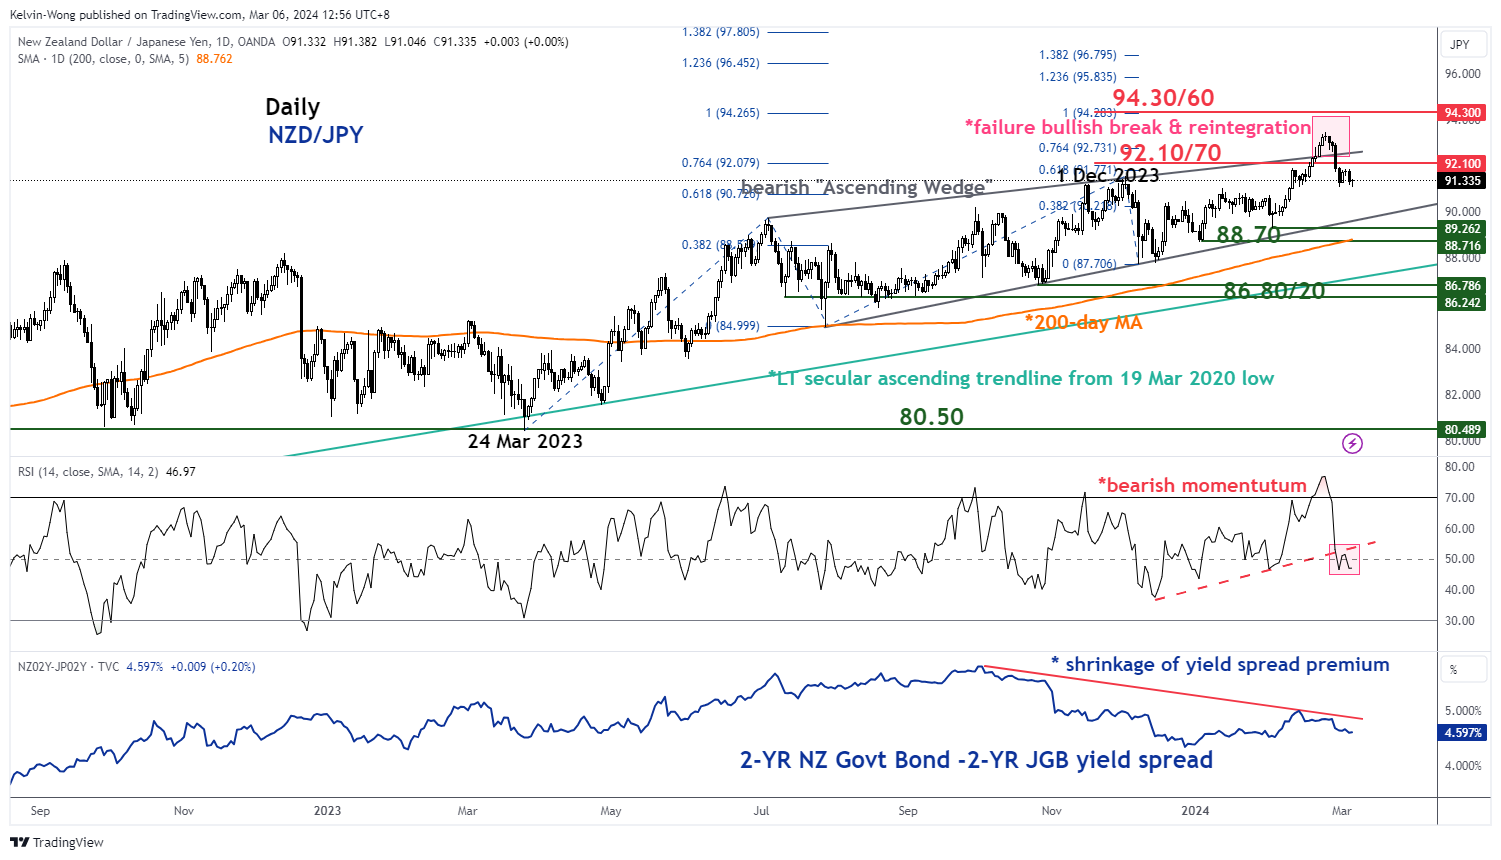
Fig 2: NZD/JPY medium-term trend as of 6 Mar 2024 (Source: TradingView, click to enlarge chart)
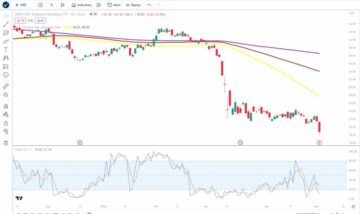
The NZD/JPY staged a failed bullish breakout between 20 to 23 February as its price actions did not again further upside traction and reintegrated back below the upper boundary/resistance of the medium-term bearish “Ascending Wedge” configuration on 28 February.
In addition, the daily RSI momentum indicator has staged a bearish breakdown below its parallel ascending support at around the 50 level on 29 February and remained below it so far which suggests a potential revival of medium-term bearish momentum.
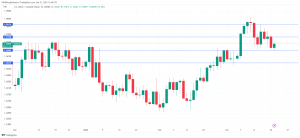
Also, from a relative fixed income yield spread perspective, the yield premium between the 2-year New Zealand Government Bond over the 2-year Japanese Government Bond (JGB) has continued to shrink from 4.99% on 13 February to 4.60% currently on 6 March at this time of the writing (see Fig 2).
These observations suggest that the “attractiveness” to hold New Zealand bonds over Japanese bonds has been reduced which also may put downside pressure on the NZD/JPY cross-pair.
Watch the 92.00 key short-term resistance on NZD/JPY
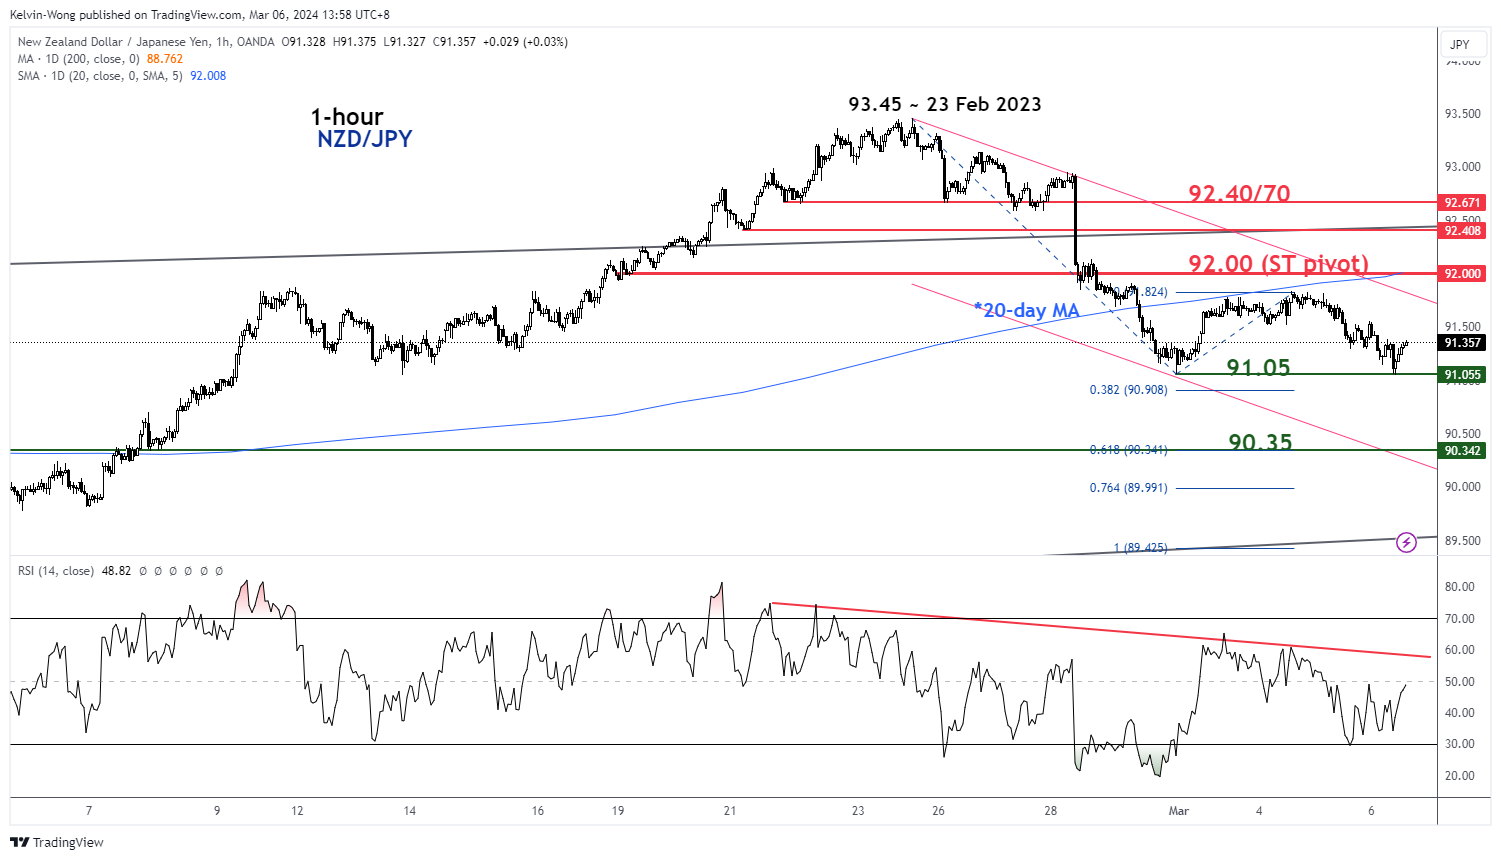
Fig 3: NZD/JPY short-term trend as of 6 Mar 2024 (Source: TradingView, click to enlarge chart)
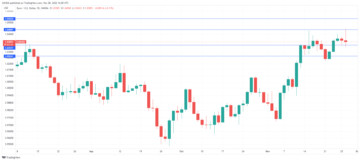
The current price actions of NZD/JPY have evolved into a minor descending channel in place since the 23 February high of 93.45 (see Fig 3).
If the 92.00 key short-term pivotal resistance (also the 20-day moving average) is not surpassed to the upside, and a break below 91.05 may see further weakness to expose the next intermediate support at 90.35 in the first step (0.618 Fibonacci extension from 23 February 2024 high & lower boundary of the minor descending channel).
On the other hand, a clearance above 92.00 negates the bearish tone for a squeeze up to see the key medium-term resistance zone coming in at 92.40/70 (also the upper boundary of the “Ascending Wedge”).
Content is for general information purposes only. It is not investment advice or a solution to buy or sell securities. Opinions are the authors; not necessarily that of OANDA Business Information & Services, Inc. or any of its affiliates, subsidiaries, officers or directors. If you would like to reproduce or redistribute any of the content found on MarketPulse, an award winning forex, commodities and global indices analysis and news site service produced by OANDA Business Information & Services, Inc., please access the RSS feed or contact us at info@marketpulse.com. Visit https://www.marketpulse.com/ to find out more about the beat of the global markets. © 2023 OANDA Business Information & Services Inc.
Passionate about connecting the dots in the financial markets and sharing perspectives around trading and investment, Kelvin Wong is an expert in using a unique combination of fundamental and technical analyses, specializing in Elliott Wave and fund flow positioning, to pinpoint key reversal levels in the financial markets.
In addition, over the last ten years, Kelvin has conducted numerous market outlook and trading-related seminars, as well as technical analysis training courses, for thousands of retail traders.
Latest posts by Kelvin Wong (see all)
- SEO Powered Content & PR Distribution. Get Amplified Today.
- PlatoData.Network Vertical Generative Ai. Empower Yourself. Access Here.
- PlatoAiStream. Web3 Intelligence. Knowledge Amplified. Access Here.
- PlatoESG. Carbon, CleanTech, Energy, Environment, Solar, Waste Management. Access Here.
- PlatoHealth. Biotech and Clinical Trials Intelligence. Access Here.
- Source: https://www.marketpulse.com/forex/nzd-jpy-technical-failure-bullish-breakout-indicates-potential-softness-jpy-strength-ahead/kwong
- :has
- :is
- :not
- :where
- $UP
- 00
- 05
- 1
- 13
- 15 years
- 15%
- 19
- 2%
- 20
- 2023
- 2024
- 23
- 24
- 26
- 28
- 29
- 31
- 35%
- 4
- 40
- 45
- 5
- 50
- 6
- 700
- 89
- 90
- 91
- a
- About
- above
- access
- actions
- addition
- advice
- advocate
- affiliates
- After
- again
- ahead
- also
- an
- analyses
- analysis
- and
- annual
- Another
- any
- April
- ARE
- around
- AS
- ascending
- At
- attention
- author
- authors
- avatar
- average
- award
- back
- Bank
- BE
- bearish
- Bearish Momentum
- beat
- been
- before
- below
- between
- biases
- Biggest
- boj
- bond
- Bonds
- both
- Box
- Break
- Breakdown
- breakout
- Bullish
- business
- buy
- by
- Calendar
- Channel
- Chart
- clearance
- click
- COM
- combination
- coming
- Commodities
- conducted
- Configuration
- Connecting
- Consensus
- contact
- content
- continued
- courses
- Cross
- Current
- Currently
- daily
- decision
- DID
- Directors
- DOT
- downside
- elements
- Elliott
- employees
- end
- enlarge
- Ether (ETH)
- Event
- events
- evolved
- exchange
- expectations
- experience
- expert
- extension
- Failed
- Failure
- far
- February
- Fed
- fed funds rate
- Federal
- federal reserve
- Federation
- Fibonacci
- Fig
- financial
- Find
- First
- fixed
- fixed income
- flashing
- flow
- Focus
- FOMC
- For
- forecasts
- foreign
- foreign exchange
- forex
- found
- from
- fund
- fundamental
- funds
- further
- FY
- General
- Global
- global markets
- Government
- Governor
- hand
- Have
- Hawkish
- High
- highest
- Highlighted
- Hit
- hold
- Horizons
- HTTPS
- if
- Impact
- in
- Inc.
- Income
- Increase
- indicated
- indicates
- Indicator
- Indices
- Inflationary
- influence
- information
- interest
- Interest Rates
- Intermediate
- into
- investment
- IT
- ITS
- January
- Japan
- Japan’s
- Japanese
- JGB
- JPY
- Kelvin
- Key
- Labour
- Last
- latest
- Level
- levels
- like
- likely
- Low
- lower
- Macro
- mar
- March
- Market
- market outlook
- market research
- MarketPulse
- Markets
- max-width
- May..
- medium
- minor
- Momentum
- Monetary
- Monetary Policy
- more
- most
- movement
- moving
- moving average
- necessarily
- negative
- negative interest rates
- negotiations
- New
- New Zealand
- news
- next
- now
- numerous
- NZD/JPY
- observations
- of
- officers
- on
- only
- Opinions
- or
- Other
- our
- out
- Outcome
- Outlook
- over
- pair
- Parallel
- part
- participants
- passionate
- Pay
- performances
- perspective
- perspectives
- photo
- pivotal
- Place
- plato
- Plato Data Intelligence
- PlatoData
- plays
- please
- plot
- policy
- positioning
- Posts
- potential
- preliminary
- Premium
- pressure
- price
- Prior
- Produced
- projected
- providing
- public
- published
- purposes
- put
- Rate
- Rates
- recap
- Reduced
- relative
- release
- Releases
- remained
- research
- Reserve
- Resistance
- Results
- retail
- Reversal
- Risk
- risks
- Rolling
- round
- rsi
- rss
- Securities
- see
- sell
- senior
- service
- Services
- set
- setting
- sharing
- short-term
- Sight
- significant
- significantly
- since
- Singapore
- site
- slightly
- So
- so Far
- solution
- Source
- specializing
- spread
- Squeeze
- Step
- Still
- stock
- Stock markets
- Strategist
- strength
- subsidiaries
- suggest
- Suggests
- support
- support level
- surpassed
- sustainable
- Technical
- Technical Analysis
- ten
- that
- The
- The US Federal Reserve
- this
- thousands
- time
- times
- to
- TONE
- traction
- Traders
- Trading
- TradingView
- Training
- Trend
- Trends
- TURN
- under
- union
- unique
- Upside
- us
- US Federal
- us federal reserve
- using
- v1
- Visit
- wage
- Watch
- Wave
- weakness
- WELL
- which
- will
- winning
- with
- wong
- would
- writing
- years
- Yield
- you
- Zealand
- zephyrnet
- zone