SNEAK PEEK:
- Optimism collaborates with Coinbase to launch a new L2 blockchain.
- Indications hint at a sustained bull run in the OP market.
- During the rise, the OP market finds support around $2.72.
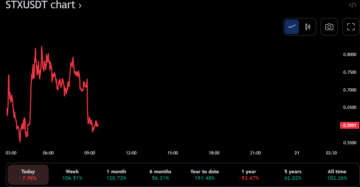
In the previous 24 hours, the Optimism (OP) market has been optimistic due to the collaboration with Coinbase in introducing a new L2 blockchain named “Base.” As a result of this news, the price of OP jumped to a 7-day high of $3.20 during the trading session. At the time of publication, the bulls had won, and the price of OP was $3.05, a 9.64% increase from its previous close.
Since then, investors have flooded the market, driving the market capitalization up to $716,794,042 and the 24-hour trading volume up to $1,067,413,889, increases of 9.68% and 84.41%, respectively.
News of Coinbase’s new Layer 2 blockchain, Base, predicted to cut settlement speeds from minutes to milliseconds, had been a significant factor in the optimistic attitude in the Optimism market. This development has contributed to an already steep increase in the cost of optimism as investors rush to take advantage of the short-term gains.

The Bollinger bands are bulging on the OP 4-hour price chart, with the upper bar at 3.130 and the lower bar at 2.255, indicating that the market is now very volatile. This kind of volatility occurs when there is a rush in demand for the OP 4-hour chart, and it suggests that traders are searching for more significant returns quickly.
However, because the price movement is moving towards the upper band, the market mood is positive, as traders are eager to profit from any price increase.
With a score of 0.05 and a southward trend, the Chaikin Money Flow (CMF) indicates substantial purchasing pressure in the market, but this pressure is insufficient to drive price action toward the upper band. However, this implies that traders continue cautiously since the market is still volatile and may see a rapid change in attitude, resulting in significant declines.
The RSI crosses over its signal line with a reading of 66.75 and heads south, indicating an anticipated selloff as the market has entered overbought territory, indicating traders should seek selling opportunities at higher levels and purchase on dips. Generally, the market remains positive, but traders should be wary of abrupt mood swings.

The OP market’s bullishness intensifies as the Bollinger band widens, with the upper band hitting 3.136 and the lower band touching 2.193, showing that traders expect the asset to continue trading above the average of 2.665. This movement suggests potential market growth since traders believe OP will continue to trade above its current average.
Moreover, as the price moves toward the upper band, it forms large green candlesticks, reinforcing the assumption that the asset will stay above its average soon.
The CMF is also positive, with a reading of 0.03, indicating that money flows into the asset as traders see it as a viable investment. This notion is bolstered further by the rising trading volume as more traders get interested in trading it.
Additionally, with a reading of 62.66, the RSI is trending above its signal line, showing that the asset is still in positive momentum, as the reading is above 50, indicating that it has further upward potential.
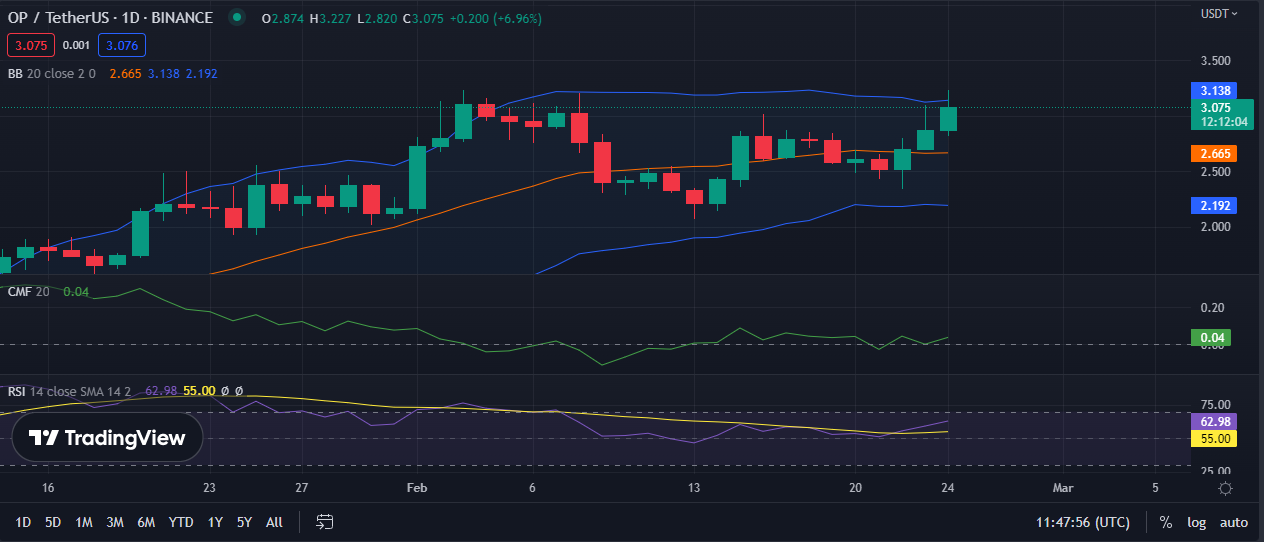
This motion indicates the asset will likely continue above its average soon, making it a good investment area. Consequently, investors have a fantastic purchasing opportunity to join the market and capitalize on the high momentum.
Disclaimer: In good faith, we disclose our thoughts and opinions in our price analysis, as well as all the facts we give. Each reader is responsible for his or her own investigation. Reader discretion is advised before taking any action.
- SEO Powered Content & PR Distribution. Get Amplified Today.
- Platoblockchain. Web3 Metaverse Intelligence. Knowledge Amplified. Access Here.
- Source: https://investorbites.com/optimism-op-price-analysis-24-2/
- $3
- 84
- 9
- a
- above
- Action
- ADvantage
- After
- All
- already
- analysis
- and
- Anticipated
- AREA
- around
- asset
- assumption
- attitude
- average
- BAND
- bar
- base
- because
- before
- believe
- Big
- Big Picture
- blockchain
- Bollinger bands
- bull
- Bull Run
- Bulls
- capitalization
- capitalize
- cautiously
- change
- Chart
- Close
- coinbase
- Coinbase Partnership
- Coinbase’s
- collaboration
- Consequently
- continue
- contributed
- Cost
- Current
- Cut
- Declines
- Demand
- Development
- Disclose
- discretion
- discussing
- drive
- driving
- during
- each
- entered
- expect
- fantastic
- finds
- flow
- Flows
- forms
- from
- further
- Gains
- generally
- get
- Give
- good
- Green
- Growth
- heads
- High
- higher
- Hits
- hitting
- HOURS
- However
- HTTPS
- important
- in
- Increase
- Increases
- indicates
- Intensifies
- interested
- internal
- introducing
- investigation
- investment
- Investors
- IT
- join
- Kind
- l2
- large
- launch
- layer
- Layer 2
- levels
- likely
- Line
- Making
- Market
- Market Capitalization
- Market News
- minutes
- Momentum
- money
- mood
- more
- motion
- movement
- moves
- moving
- Named
- New
- news
- Notion
- OP
- OP Price
- Opinions
- opportunities
- Opportunity
- Optimism
- Optimism (OP)
- optimism price
- Optimistic
- own
- Partnership
- picture
- plato
- Plato Data Intelligence
- PlatoData
- positive
- potential
- predicted
- pressure
- previous
- price
- PRICE ACTION
- Price Analysis
- price chart
- Price Increase
- Profit
- Publication
- purchase
- purchasing
- quickly
- rapid
- Reader
- Reading
- remains
- responsible
- result
- resulting
- returns
- Revealed
- Rise
- rising
- rsi
- Run
- rush
- searching
- Seek
- Selling
- SellOff
- session
- settlement
- short-term
- should
- Signal
- significant
- since
- Soon
- Source
- South
- speeds
- stablecoin
- stay
- Still
- substantial
- Suggests
- support
- sustained
- Swings
- Take
- taking
- The
- time
- to
- touching
- toward
- towards
- trade
- Traders
- Trading
- trading volume
- TradingView
- Trend
- trending
- upward
- viable
- volatile
- Volatility
- volume
- What
- What is
- will
- Won
- zephyrnet