The morale of the Bitcoin team seemed low over the last few months. That and a flat market didn’t stop the “plebs” from constantly “stacking sats.” The following chart shows that the Bitcoin addresses that hold between 0.1 and 1.0 BTC kept acquiring Bitcoin through this whole period. What does that mean, though? And why is it a sign of something phenomenal and never-before-seen? That’s what we’re here to explore.
Related Reading | Hopium: Four Experts Give You Reasons To Smile Despite The Crypto Bloodbath
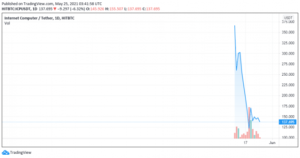
But first, the chart in question from on-chain analyst Will Clemente:
https://twitter.com/WClementeIII/status/1420382864970076164
Before analyzing it, we need to establish a few core concepts.
Who Are The “Plebs”?
The self-proclaimed “Plebs” are Bitcoin’s white blood cells. Its defense mechanism. They’re Bitcoin maximalists of the most extreme order that defend Bitcoin and attack all of its enemies with rhetoric and verbal poison. Their name is inspired by the Roman plebeians, and in the introduction of an article about the original ones, Bitcoin Magazine says:
In this memo, I look into the original plebs — the plebeian class of ancient Rome. The bitcoin plebs are the solid core of the community, and the bitcoin rabbit hole has encouraged all of us to read history with fresh eyes.
That little paragraph says a lot about the Bitcoin “plebs” and their attitude towards life. For a more specific definition, let’s quote New Day Crypto:
There are many different labels, but I will call this sub-specie “bitcoin plebs”. This is a special type of bitcoin, which is even less common, but represents something like special forces in this battle. These are rude and uncompromising people who stand in the first line of defense of Bitcoin and everything that it symbolizes.
What Is DCA Or Dollar-Cost Averaging? Why Are Plebs Doing It?
This investment technique seems tailor-made for Bitcoin. Buying an asset constantly, over time, reduces “the impact of volatility on the overall purchase.” That is what “plebs” do. That is what the original chart shows. For a more detailed definition, let’s quote Investopedia:
Dollar-cost averaging (DCA) is an investment strategy in which an investor divides up the total amount to be invested across periodic purchases of a target asset in an effort to reduce the impact of volatility on the overall purchase. The purchases occur regardless of the asset’s price and at regular intervals. In effect, this strategy removes much of the detailed work of attempting to time the market in order to make purchases of equities at the best prices.
What Is An Inelastic Demand For A Product?
Trust us, we’ll need this concept. One of the amazing things the original chart shows is an “inelastic demand” for bitcoin. What is that exactly? Let’s quote Investopedia again:
An inelastic product, on the other hand, is defined as one where a change in price does not significantly impact demand for that product.
Should demand for a good or service be static when its price or other factor changes, it is said to be inelastic. In other words, when the price changes or consumer’s incomes change, they will not change their buying habits.
Inelastic products are necessities and, usually, do not have substitutes they can easily be replaced with.
That definition applies to a certain class of products in a stable market, and they’re special enough. Bitcoin is, as you might know, very volatile. And it’s still an inelastic product. Plebs love that stuff.

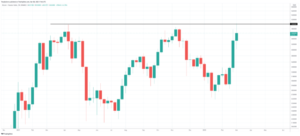
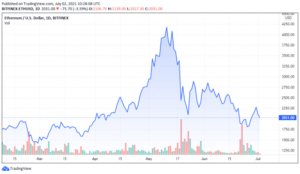
BTC price chart on Bitstamp | Source: BTC/USD on TradingView.com
What Did The Chart Show, Anyway?
Once upon a time, Paul Tudor Jones asked Stan Druckenmiller:
“Do you know that when Bitcoin went from $17,000 to $3000 that 86% of the people that owned it at $17,000, never sold it?” Druckenmiller replied: Well, this was huge in my mind. So here’s something w/ a finite supply & 86% of the owners are religious zealots.
To explain how this relates to the chart, let’s bring an expert witness: Pseudonymous Bitcoin philosopher Pi Prime Pi. His thread about the subject started with the following tweet:
https://twitter.com/PiPrimePi/status/1419402727537483778
And through the thread we learned:
- The charts show a “10 year inelastic demand curve.”
- Throughout those 10 turbulent years, Bitcoin was “an asset, with 70vol, that had a 100x move, and several 50+% corrections, From ~$300 to $60,000+.”
- That means that “for the last 10 years, regardless of press or price, these people just kept buying.” These people are the plebs, but they’re also normal everyday people just going about their day. And stacking sats.
- But wait. “its more impressive than that, as soon as they acquire 1.00+ BTC they fall off this chart, so they are being replaced by others, that are doing the same.”
Related Reading | Following The Biggest Scam In Bitcoin History, South Africa To Tighten Crypto Regulation
It’s important to know that “These aren’t $ value charts, these are total bitcoin controlled, regardless of value charts.”
And now, you know everything you need to know to start Dollar-Cost Averaging. You don’t need to be a pleb to do that. What you would need to do, though, is your own research. Reach your own conclusions. This isn’t financial advice.
Featured Image by Mark Duffel on Unsplash - Charts by TradingView
- "
- &
- 000
- 100x
- advice
- africa
- All
- analyst
- Army
- article
- asset
- Battle
- BEST
- Biggest
- Bitcoin
- Bitstamp
- blood
- BTC
- BTC/USD
- BTCUSD
- Buying
- call
- change
- Charts
- Common
- community
- Corp
- Corrections
- crypto
- curve
- day
- Defense
- Demand
- DID
- etc
- experts
- financial
- First
- follow
- fresh
- good
- here
- history
- hold
- How
- HTTPS
- huge
- image
- Impact
- industry
- Institution
- investment
- investor
- IT
- Labels
- lead
- learned
- Line
- love
- Market
- months
- move
- order
- Other
- Others
- owners
- People
- poison
- press
- price
- Product
- Products
- purchase
- purchases
- Reading
- reasons
- reduce
- research
- Scam
- So
- sold
- South
- South Africa
- Staked
- start
- started
- Strategy
- supply
- Target
- time
- tweet
- us
- value
- Volatility
- wait
- What is
- WHO
- words
- Work
- year
- years