
- DOT price has fallen roughly -8% over the last week
- DOT Price has been holding the 75MA for over a month
- DOT has been stuck within an ascending channel
Are Bears Back in Control?
Polkadot (DOT) price is showing some signs that a pullback may be underway. BTC & ETH have stalled at their resistance levels over the last couple days and have since started falling to lower support levels. This bearish price action has also pulled down the majority of alt coins as they have been up trending for many weeks now.
Based on todays price action, there is still room to drop before we can say there is a confirmed bear trend in place. Although, this retracement is well needed for the majority of coins.
Since Polkadot hit its low in late July, price has revived nearly 140%. Throughout this bullish trend, price has managed to form an ascending channel formation. Each time price hits either trend, it usually gets shot right to the other side. As long as price continues within this ascending channel, it will go on to make monthly highs.
More importantly, for DOT to continue this uptrend, bulls must break & hold the major resistance zone from $27.54-$29.00. If this is deemed successful, DOT will have a shot at hitting mid $30s.
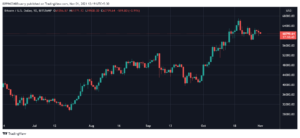
Polkadot Price Analysis: DOT/USDT 4 Hour Chart

At the time of writing, DOT price is inches away from breaking below the bottom trend of its channel. This trend has held price up for over a month now. If bulls fail to regain the minor resistance mark of $25.97, DOT price may be in for a fall beneath this trend line. In the case this happens, expect price to land in its major support zone followed by $20.89. Before this -10% fall can occur, bulls would have to give up the 75MA. This MA has held price up for over a month now & a break below will surely cause a cascade of selling to take place.
While looking at the Stochastic RSI, we can see that strength has been hanging out within the oversold region for the last two days. Strength must break above the 20 value to start some type of bounce off its current trend line. Breaking above the 50 value will likely land price back in its major resistance zone. On a note of concern, the regular RSI has broken below a 33 day support trend. This trend has held strength up ever since DOT hit its low. It must regain this trend very soon or further downside is coming.
DOT Intraday Analysis
- Spot rate: $25.50
- Trend: Bullish
- Volatility: High
- Support: $24.32
- Resistance: $25.97
advertisement
Disclaimer
The presented content may include the personal opinion of the author and is subject to market condition. Do your market research before investing in cryptocurrencies. The author or the publication does not hold any responsibility for your personal financial loss.

Handpicked Stories
Related Posts
Loading Next Story
Source: https://coingape.com/polkadot-dot-nears-bottom-channel-bears-back-control/
- "
- &
- 77
- 9
- Action
- All
- Altcoin
- Altcoin News
- amp
- analysis
- AR
- article
- bearish
- Bears
- BTC
- Bullish
- Bulls
- Cause
- Coingape
- Coins
- coming
- comments
- content
- continue
- continues
- Couple
- creator
- cryptocurrencies
- Current
- day
- DOT/USDT
- Drop
- ETH
- ethbtc
- ETHUSD
- financial
- form
- hold
- HTTPS
- ICON
- image
- inches
- investing
- IT
- July
- large
- Line
- Long
- major
- Majority
- mark
- Market
- market research
- news
- Opinion
- Other
- Polkadot
- Polkadot (DOT)
- price
- Price Analysis
- Profile
- research
- robots
- Share
- Signs
- start
- started
- successful
- support
- time
- trending
- value
- W
- within
- writing
- XML


✓ Share: