Published 30 mins ago
The Polkadot price analysis shows a modest recovery. But, the downside risk remains intact below $8.0. The longer the time remained below the critical level, the more pressure would build up on the buyers. The formation of a bullish hammer on August 22 shows a tug-of-war between bulls and bears.
advertisement
Right, now the price is trading in the green for the past few hours, indicating buyers are still in the game. As of publication time, DOT/USD is reading at $7.61, up 0.83% for the day. The 24-hour trading volume dropped nearly 5% to $290,548,901 according to CoinMarketCap data.
- Polkadot price analysis indicates a consolidation move on Thursday.
- An upward parallel channel suggests the continuation of an upside movement.
- A daily close above 23.6% Fibonacci retracement would confirm more gains.
Polkadot price stabilizes with positive bias
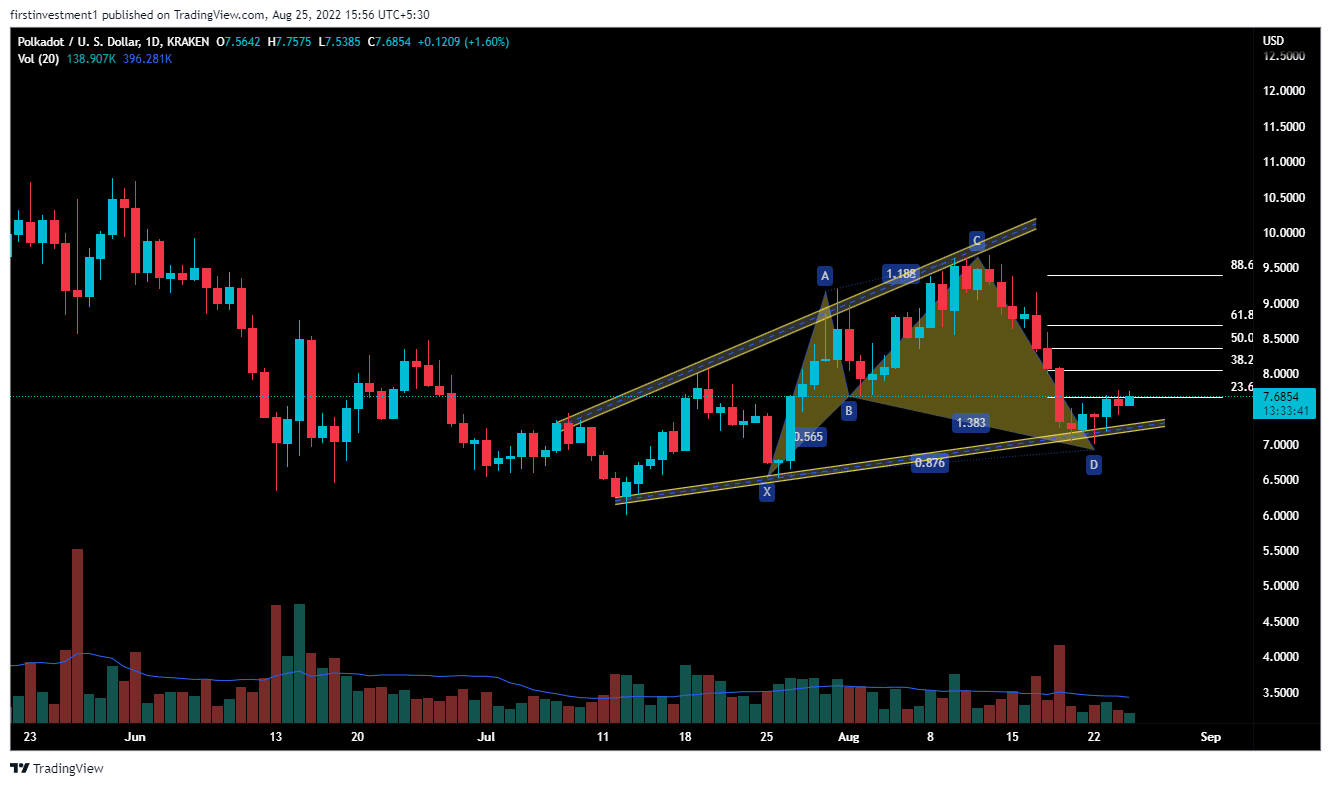
On the daily chart, DOT is trading in an ascending channel. As the recent price action indicates the movement in between two parallel upward-sloping lines. It is formed from two positive sloping trend lines drawn above and below a price series depicting resistance and support levels, respectively.
The price is making higher highs and higher lows. According to this pattern, if the price starts to move higher from its support level, with above the average volumes, then we can expect a good upside move. Otherwise, the price may not sustain higher for a long time.
Trending Stories
Further, the Polkadot price analysis indicates the formation of a bullish “Bullish Shark” harmonic pattern. In a bullish shark pattern, however, the second top is higher than the first one. In addition, it combines Fibonacci with Elliott’s waves theory, and some new ratios like 88.6% are used. Along with this bullish pattern. The price hasn’t broken its previous swing low as well, indicating a possible reversal in the coming future.
According to this pattern, if the price closes above a strong bearish candle, testing the 88.6% Fib. level ($8.02), then we can expect a bullish movement of up to ($8.5).
On the flip side, a slippage below $7.45 would make bears hopeful.

On the hourly chart, the price formed a bullish “Head & Shoulder” pattern. If the price gave a closing above $7.80 on the hourly chart, we can expect a bullish momentum up to $8.02.
On the other hand, closing below the $7.40 level could invalidate the bullish outlook. And the price can drop below $7.1.
advertisement
DOT is modestly bullish on all time frames. If the price gave closing above $7.80 on the hourly chart, we can put our buy trade.
Share this article on:
The presented content may include the personal opinion of the author and is subject to market condition. Do your market research before investing in cryptocurrencies. The author or the publication does not hold any responsibility for your personal financial loss.
- Bitcoin
- blockchain
- blockchain compliance
- blockchain conference
- coinbase
- Coingape
- coingenius
- Consensus
- crypto conference
- crypto mining
- cryptocurrency
- decentralized
- DeFi
- Digital Assets
- ethereum
- machine learning
- non fungible token
- plato
- plato ai
- Plato Data Intelligence
- Platoblockchain
- PlatoData
- platogaming
- Polkadot Price Analysis
- Polygon
- Price Analysis
- proof of stake
- W3
- zephyrnet