TL;DR Breakdown
- Polkadot price is expected to move downwards as bears dominate
- DOT faces resistance at the $40.50 mark
- The closest support level lies at $37.50
After climbing to the $49.0 mark, Polkadot price failed to continue its bullish rally, and the price has seen a steady drop ever since. While the buyers defend the rice just above the $40.00 mark, the bearish pressure is very strong and prevents the price action from rising to the $41.00 mark.
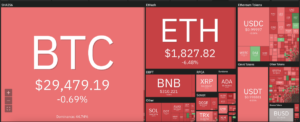
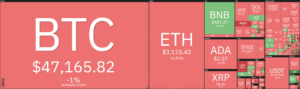
The broader cryptocurrency market observes a bearish sentiment across the last 24 hours, with most major cryptocurrencies recording a loss across the timeframe. Main currencies which had a loss include ADA and BNB that record an 8.66 and a 9.86 percent decrease, respectively. Meanwhile, Bitcoin and Ethereum record a 7.79 and a 6.75 percent decrease, respectively.
Technical analysis for DOT/USDT

Across the technical indicators, the MACD shows a declining bearish momentum. While the histogram is still red at the time of writing, the histogram’s size has decreased significantly as the indicator is at press time oscillating around the 0.30 mark. Across the EMAs, the 12-EMA still trades below the 26-EMA, the difference between the two is significant, and they won’t show a reversal at any time.
The RSI is currently trading in the neutral zone a little below the 46.00 mark and does not issue a signal. The indicator has been trading in the neutral zone for the past two days. At press time, the RSI has had a small spike towards the oversold region, suggesting an increasing bearish presence at the current price level.
The Bollinger bands are currently wide but are converging rapidly as the bears take charge of the market momentum. The bands’ convergence suggests a drop in volatility for the Polkadot price in the short term. Moreover, as the Polkadot price is consolidating below the bands’ mean line, the bands will be leaning downwards for the next few candlesticks.
Overall the 4-hour technical analysis issues a weak sell signal with 10 of the total 26 major technical indicators suggesting their support for a bearish movement. On the other hand, only six indicators issue buy signals suggesting a bullish movement. Meanwhile, ten indicators sit on the fence, issuing no support for either side of the market.
The 24-hour technical analysis does not share this sentiment and issues a buy signal with 12 of the 26 indicators suggesting a bullish movement against only four indicators suggest a bearish retracement. Meanwhile, ten indicators remain neutral and do not issue any signals at the time of writing.
What to expect from Polkadot price?

Polkadot price is currently facing strong selling pressure above the $40.00 mark. Currently, the price is moving downwards as the bears currently dominate the market momentum. However, the strong support level lies at the $37.50 mark. The technical indicators suggest a downwards movement to the $36.00 mark before the selling pressure subsides.
Disclaimer. The information provided is not trading advice. Cryptopolitan.com holds no liability for any investments made based on the information provided on this page. We strongly recommend independent research and/or consultation with a qualified professional before making any investment decisions.
Source: https://www.cryptopolitan.com/polkadot-price-prediction-2021-05-12/
- 7
- 9
- Action
- advice
- analysis
- around
- bearish
- Bearish Momentum
- Bears
- Bitcoin
- Bullish
- buy
- charge
- continue
- cryptocurrencies
- cryptocurrency
- cryptocurrency market
- currencies
- Current
- Drop
- ethereum
- faces
- facing
- HTTPS
- information
- investment
- Investments
- issues
- Level
- liability
- Line
- major
- Making
- mark
- Market
- Momentum
- move
- Other
- prediction
- press
- pressure
- price
- Price Prediction
- rally
- research
- sell
- sentiment
- Share
- Short
- SIX
- Size
- small
- support
- support level
- Technical
- Technical Analysis
- time
- trades
- Trading
- Volatility
- writing