While the overall crypto market surged marginally, Polkadot hit its ATH after following a bullish price action for the past three months. However, near-term technicals for the alt flashed mixed signals.
While Avalanche displayed continued bullish tendencies over time, Shiba Inu technicals preferred the sellers in the near term.
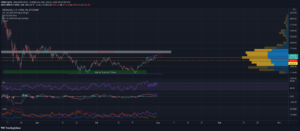
Polkadot (DOT)

TradingView, DOT/USDT
After a sustained rally of over three months, DOT finally touched its ATH on 2 November at $53.35 ahead of its parachain launch. Since 20 July, the eighth-biggest crypto undertook a bullish price action by oscillating in an ascending wedge pattern.
As a result, the alt registered a staggering 169.41% 3-month ROI. After breaching its immediate support at $44.87, DOT bulls pushed and aimed to create a new resistance near its ATH. At press time, DOT traded at $51.93 after noting a 15.2% weekly gain. However, the near-term technicals of the altcoin flashed mixed signals.
The Relative Strength Index (RSI) stood near the overbought territory and visibly depicted bullish momentum. Also, the lower trendline marked higher lows, whereas the RSI trendline marked lower lows, indicating a possibility of continued bullish momentum.
Additionally, DMI lines reaffirm the buying strength with a powerful directional trend. However, the Awesome Oscillator (AO) flashed red signals along with a sharp decline in trading volumes, hinting at a possible correction.
Shiba Inu (SHIB)

TradingView, SHIB/USD
The meme token undertook a bullish price action from 23 October. Consequently, it reached its ATH on 28 October and witnessed a slight pullback. Over the last week, the price oscillated in an uptrend as the crypto noted a nearly 37% weekly ROI.
However, near-term technicals suggested increasing selling pressure. The altcoin traded at $0.00006529 while the SHIB army found support at $0.0000618.
The RSI displayed a decreasing trend in favor of sellers while it stood below the half-line. Additionally, the MACD flashed red signals reiterating increasing selling power. The third peak of the AO histogram was lower than the second, hinting at bearish tendencies.
Nonetheless, the lower trendline marked higher lows, whereas the RSI trendline marked lower lows, indicating a possibility of bullish momentum.
Avalanche (AVAX)

TradingView, AVAX/USDT
During the past three weeks, AVAX followed a gradual uptrend and noted nearly 10.70% monthly ROI. After reaching its 25-day high on 26 October, AVAX witnessed a pullback as bears exerted pressure on increasing trading volumes. Since the setback, the alt noted a 17.28% increase over the past week and traded at $71.32 at press time.
The RSI stood in the overbought territory, indicating a one-sided preference for buyers. Also, the MACD histogram and AO flashed green signals while the MACD line headed north. Nevertheless, since the RSI was at the 72-mark, chances of a reversal do exist.
Where to Invest?
Subscribe to our newsletter
Source: https://ambcrypto.com/polkadot-shiba-inu-avalanche-price-analysis-3-november/