
Image by Author
As a data scientist working in industry, the past year has felt like a rollercoaster ride of new tech breakthroughs and AI innovations.
Tools like ChatGPT, Notable, Pandas AI, and the Code Interpreter have saved me considerable amounts of time in performing tasks like writing, research, programming, and data analysis.
And just when I thought things couldn’t get any better, Microsoft and Anaconda announced the integration of Python into Excel!
You can now write Python code to analyze data, build machine learning models, and create visualizations within Excel spreadsheets.
The ability to write Python code within Excel will open new doors for data scientists and analysts.
When I got my first data science job, I assumed I’d be doing most of my work in Jupyter Notebooks. To my surprise, I ended up having to learn to use Excel on my first day of the job, since upper management, stakeholders, and clients preferred to interpret results from spreadsheets.
In fact, I’ve even created Tableau dashboards in the past to present results to clients, only to end up rebuilding the charts in Excel since they were more familiar with the platform.
And this isn’t unique to my organization. As of 2023, over a million companies and 1.5 billion people around the world use Excel.
Many data practitioners, like myself, find themselves constantly switching between Python IDEs and Excel spreadsheets. We use the former to build machine learning models and analyze data, and the latter to present our findings.
A Python-Excel integration will help data scientists and analysts streamline our workflows, by allowing us to perform data analysis, modeling, and presentation within a single platform.
Still not convinced?
Let’s explore some potential use cases of this combination.
Here are some ways in which data scientists can combine the functionality of spreadsheets with Python’s vast array of libraries:
1. Data Pre-Processing
If there is one part of my job I would gladly outsource, it is data preparation. This is a cumbersome task that becomes extremely time-consuming when using native Excel functions.
With the new Python-Excel integration, users can now import libraries like Pandas directly into Excel, and perform advanced filtering and data aggregation directly within Excel spreadsheets.
You can simply type “=PY” into a cell in a spreadsheet and highlight the data you want to analyze with Python, and a Pandas dataframe will be created for you. You can proceed to group and manipulate this data as you would in a Jupyter Notebook.
Here is an example of how you can create a Pandas dataframe in Excel:
Source: Microsoft
2. Machine Learning
While Excel offers basic tools like linear regression and trendline fitting in charts, most machine-learning use cases require more complex modeling techniques that go beyond the native capabilities of Excel.
With this Python-Excel integration, users can now build and train advanced statistical models within Excel using libraries like Scikit-Learn. The model outcomes can be visualized and presented in Excel, bridging the gap between modeling and decision-making in a single platform.
Here is an image showcasing just how simple it is to build a decision tree classifier in Excel with Python:
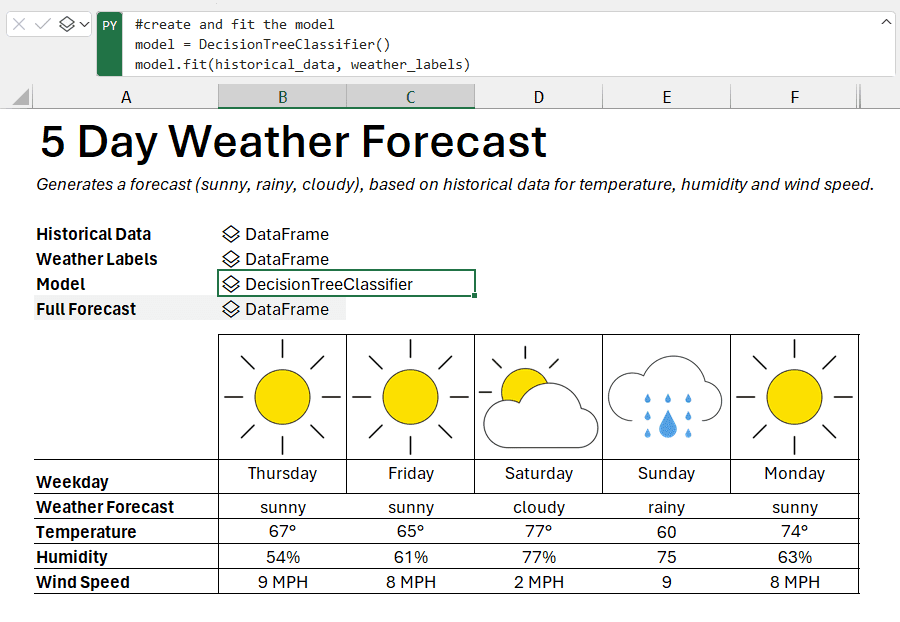
Source: Microsoft
3. Data Analysis
The process of analyzing data in Excel can be painstaking – when working with multiple files at once, users need to copy and paste data manually, drag formulas across cells, and combine data manually.
For example, if I have five sheets of monthly sales data that looks like this:
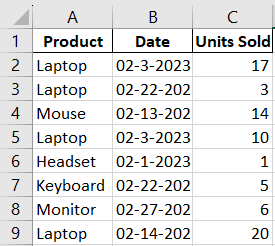
If I wanted to find products with more than 100 units sold in the span of a month, I’d first have to manually copy data from all sheets and paste it below the data in the first sheet. Then, I’d have to change the date format and create a pivot table.
Finally, I’d have to add a filter to find the products that match my criteria.
Every time I get new sales data in a different file or sheet, I need to copy and paste it manually.
This process becomes increasingly difficult and error-prone as the amount of data increases.
Instead, the entire analysis can be streamlined in Python using the following lines of code:
# 1. Merge the data
df_merged = pd.concat([df_jan, df_feb], ignore_index=True) # 2. Convert the date format
df_merged['Date'] = pd.to_datetime(df_merged['Date']).dt.strftime('%Y-%m-%d') # 3. Compute the total units sold for each product
grouped_data = df_merged.groupby('Product').agg({'Units Sold': 'sum'}).reset_index() # 4. Identify products that sold more than 100 units
products_over_100 = grouped_data[grouped_data['Units Sold'] > 100] products_over_100
Every time new data comes in, I just need to change one line of code and re-run the program to get the desired result. With a Python-Excel integration, I get to maximize efficiency while overseeing the entire data analysis workflow within a single platform.
4. Data Visualization
Although Excel itself offers a multitude of visualization options, the tool is still somewhat limited in the types of charts you can build. Charts like violin plots, heatmaps, and pair plots aren’t readily available in Excel, making it difficult for data scientists to represent complex statistical relationships.
The ability to run Python code will allow Excel users to use libraries like Matplotlib and Seaborn to create more complex, highly customizable charts.
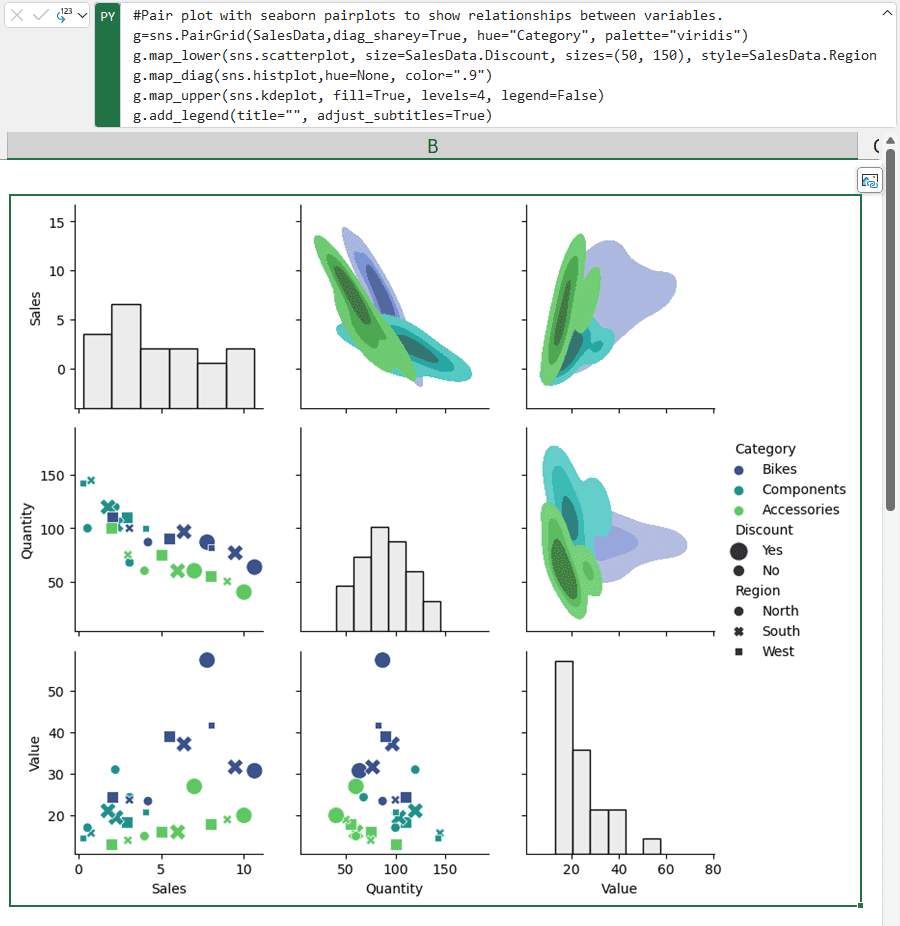
Source: Microsoft
At the time of writing this article, the Python-Excel feature is only available via the Microsoft 365 Insider Program. You need to sign up and choose the Beta Channel Insider level to access this feature, since it hasn’t been rolled out to the public yet.
Once you join the 365 Insider program, you will find a Python section in the Formulas tab. You just need to click on “Insert Python.” You can click on it to start writing your own Python code.
Alternatively, you can just type =PY into any cell to get started.
Source: Anaconda
With the release of ChatGPT, along with plugins such as the Code Interpreter and Notable, many tasks that once required strong technical expertise have become easier to perform.
This is especially true for data scientists and analysts – you can now upload CSV files to ChatGPT, and it will clean, analyze, and build models on your datasets.
In my opinion, the Python-Excel integration brings us one step closer to the democratization of data science and analytics.
In fields like marketing and finance, industry experts who work solely in Excel will now be able to execute Python code to analyze their data without even having to download a programming IDE.
The ability to work with data in an interface they are familiar with, coupled with ChatGPT’s proficiency in writing code, will allow non-programmers to perform data science workflows and solve problems with Python code.
If you are an Excel user who doesn’t know how to code, this is a great opportunity for you to learn Python programming within an interface that you are already comfortable with.
Natassha Selvaraj is a self-taught data scientist with a passion for writing. You can connect with her on LinkedIn.
- SEO Powered Content & PR Distribution. Get Amplified Today.
- PlatoData.Network Vertical Generative Ai. Empower Yourself. Access Here.
- PlatoAiStream. Web3 Intelligence. Knowledge Amplified. Access Here.
- PlatoESG. Carbon, CleanTech, Energy, Environment, Solar, Waste Management. Access Here.
- PlatoHealth. Biotech and Clinical Trials Intelligence. Access Here.
- BlockOffsets. Modernizing Environmental Offset Ownership. Access Here.
- Source: https://www.kdnuggets.com/python-in-excel-this-will-change-data-science-forever?utm_source=rss&utm_medium=rss&utm_campaign=python-in-excel-this-will-change-data-science-forever
- :has
- :is
- :not
- $UP
- 1
- 100
- 12
- a
- ability
- Able
- access
- across
- add
- advanced
- aggregation
- AI
- All
- allow
- Allowing
- along
- already
- amount
- amounts
- an
- analysis
- Analysts
- analyze
- analyzing
- and
- announced
- any
- ARE
- around
- Array
- article
- AS
- assumed
- At
- available
- basic
- BE
- become
- becomes
- been
- below
- beta
- Better
- between
- Beyond
- Billion
- breakthroughs
- bridging
- Brings
- build
- by
- CAN
- capabilities
- cases
- cell
- Cells
- change
- Channel
- Charts
- ChatGPT
- Choose
- click
- clients
- closer
- code
- combination
- combine
- comes
- comfortable
- Companies
- complex
- Compute
- Connect
- considerable
- constantly
- convert
- convinced
- coupled
- create
- created
- criteria
- cumbersome
- customizable
- dashboards
- data
- data analysis
- Data Preparation
- data science
- data scientist
- datasets
- Date
- day
- decision
- Decision Making
- decision tree
- desired
- different
- difficult
- directly
- Doesn’t
- doing
- doors
- download
- each
- easier
- efficiency
- end
- ended
- Entire
- especially
- Even
- example
- Excel
- execute
- expertise
- experts
- explore
- extremely
- fact
- familiar
- Feature
- Fields
- File
- Files
- filter
- filtering
- finance
- Find
- findings
- First
- fitting
- five
- following
- For
- forever
- format
- Former
- from
- functionality
- functions
- gap
- get
- gif
- Go
- got
- great
- Group
- Have
- having
- help
- her
- Highlight
- highly
- How
- How To
- HTML
- HTTPS
- i
- identify
- if
- image
- import
- in
- Increases
- increasingly
- industry
- industry experts
- innovations
- Insider
- integration
- Interface
- into
- IT
- itself
- Job
- join
- Jupyter Notebook
- just
- KDnuggets
- Know
- LEARN
- learning
- Level
- libraries
- like
- Limited
- Line
- lines
- LOOKS
- machine
- machine learning
- Making
- management
- manually
- many
- Marketing
- Match
- matplotlib
- Maximize
- me
- Merge
- Microsoft
- million
- model
- modeling
- models
- Month
- monthly
- more
- most
- multiple
- multitude
- my
- myself
- native
- Need
- New
- New Tech
- notable
- notebook
- notebooks
- now
- of
- Offers
- on
- once
- ONE
- only
- open
- Opinion
- Opportunity
- Options
- or
- organization
- our
- out
- outcomes
- outsource
- over
- overseeing
- own
- pair
- pandas
- part
- passion
- past
- People
- perform
- performing
- Pivot
- platform
- plato
- Plato Data Intelligence
- PlatoData
- plugins
- potential
- preferred
- preparation
- present
- presentation
- presented
- problems
- proceed
- process
- Product
- Products
- Program
- Programming
- public
- Python
- readily
- rebuilding
- regression
- Relationships
- release
- represent
- require
- required
- research
- result
- Results
- Ride
- Rolled
- rollercoaster
- Run
- sales
- saved
- Science
- Scientist
- scientists
- scikit-learn
- seaborn
- Section
- sheet
- showcasing
- sign
- Simple
- simply
- since
- single
- sold
- solely
- SOLVE
- some
- somewhat
- span
- Spreadsheet
- stakeholders
- start
- started
- statistical
- Step
- Still
- streamline
- streamlined
- strong
- such
- surprise
- table
- Tableau
- Task
- tasks
- tech
- Technical
- techniques
- than
- that
- The
- the world
- their
- themselves
- then
- There.
- they
- things
- this
- thought
- time
- time-consuming
- to
- tool
- tools
- Total
- Train
- tree
- true
- type
- types
- unique
- units
- us
- use
- User
- users
- using
- Vast
- via
- visualization
- want
- wanted
- ways
- we
- were
- when
- which
- while
- WHO
- will
- with
- within
- without
- Work
- workflow
- workflows
- working
- world
- would
- write
- writing
- year
- yet
- you
- Your
- zephyrnet