A quant has explained how the indicators like taker buy/sell ratio and Coinbase premium index can influence the price of Ethereum.
Ethereum’s Relationship With Taker Buy/Sell Ratio & Coinbase Premium Index
In a new CryptoQuant quicktake post, an analyst has discussed some metrics that could hold relevance for the ETH price. The first indicator of interest here is the “taker buy/sell ratio,” which tells us about the ratio between the Ethereum buy and sell orders in the market right now.
When this metric has a value greater than 1, it means that the taker buy volume is higher than the taker sell volume. Such a trend implies that the majority of the investors are bullish on the asset currently.
On the other hand, values below the threshold naturally imply the dominance of bearish sentiment, as there are currently more sell orders present on exchanges.
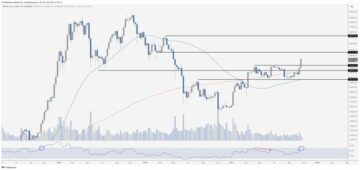
Now, here is a chart that shows the trend in the 50-day moving average (MA) Ethereum taker buy/sell ratio over the past few years:
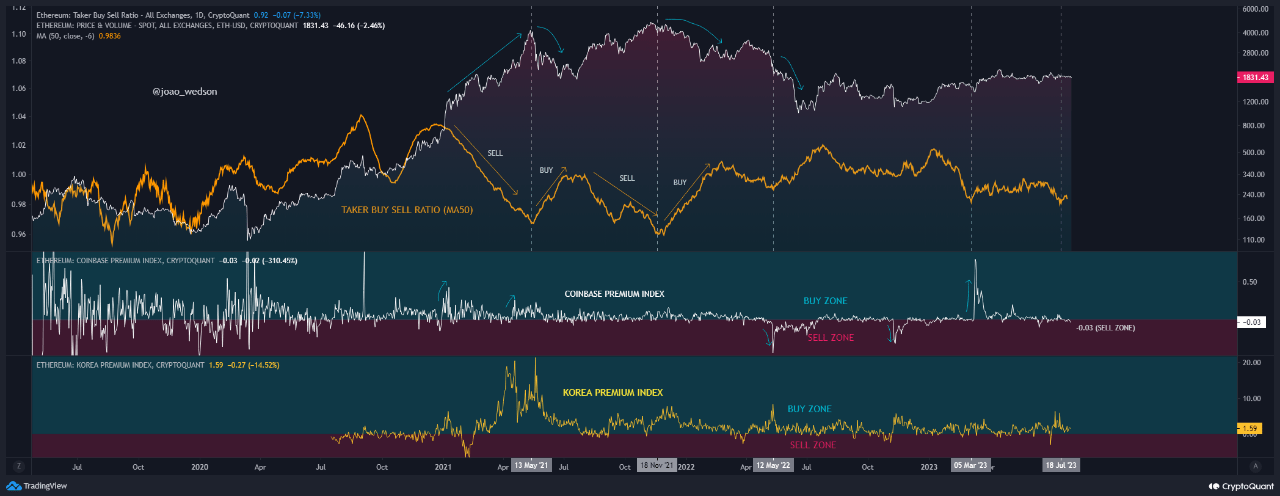
The potential relationship between these indicators and the value of the cryptocurrency | Source: CryptoQuant
As you can see in the above graph, the quant has highlighted the pattern that the Ethereum price and the 50-day MA taker buy/sell ratio have possibly followed during the past couple of years.
It would appear that whenever the value of the asset has rallied, the taker buy/sell ratio has gone down. This would suggest that the sell orders on the market pile up as the ETH price trends up.
The analyst notes that this is naturally because the investors become more cautious as the price continues to rise since they think a correction may be coming soon.
The sell orders continue until the cryptocurrency has topped out, and once the decline hits the asset, the buy orders start going up instead.
From the chart, it’s visible that significant accumulation periods have generally paved the way for the price to bottom out and begin another rally.
The quant has also attached data for another metric: the Coinbase Premium Index. This indicator keeps track of the difference in the Ethereum prices listed on Coinbase and Binance.
Whenever this metric has a positive value, it means that the Coinbase platform has BTC listed at a higher price than Binance currently. This implies that buying pressure has been stronger from US-based investors, who usually use the former exchange. Similarly, negative values imply just the opposite.
According to the analyst, major fluctuations in the Ethereum price have generally come with strong changes in the Coinbase premium index, a possible sign that activity on the exchange is the driver for these price moves.
Currently, the 50-day MA taker buy/sell ratio is at relatively low values and is looking to turn around, although this trend shift towards buy order dominance isn’t confirmed just yet.
The Coinbase Premium Index is at neutral values, implying that there hasn’t been any trading activity happening on the platform that’s different from Binance. Given these trends, it’s possible that Ethereum may not see any big moves in the near future.
ETH Price
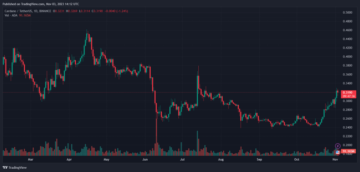
At the time of writing, Ethereum is trading around $1,830, up 2% in the last week.
ETH has erased its gains from yesterday | Source: ETHUSD on TradingView
Featured image from DrawKit Illustrations on Unsplash.com, charts from TradingView.com, CryptoQuant.com
- SEO Powered Content & PR Distribution. Get Amplified Today.
- PlatoData.Network Vertical Generative Ai. Empower Yourself. Access Here.
- PlatoAiStream. Web3 Intelligence. Knowledge Amplified. Access Here.
- PlatoESG. Automotive / EVs, Carbon, CleanTech, Energy, Environment, Solar, Waste Management. Access Here.
- BlockOffsets. Modernizing Environmental Offset Ownership. Access Here.
- Source: https://www.newsbtc.com/news/ethereum/quant-explains-how-these-indicators-affect-ethereum-price/
- :has
- :is
- :not
- $UP
- 1
- 2%
- a
- About
- above
- accumulation
- activity
- affect
- also
- Although
- an
- analyst
- and
- Another
- any
- appear
- ARE
- around
- AS
- asset
- At
- attached
- average
- BE
- bearish
- because
- become
- been
- begin
- below
- between
- Big
- binance
- Bottom
- BTC
- Bullish
- buy
- Buying
- CAN
- cautious
- Changes
- Chart
- Charts
- coinbase
- COM
- come
- coming
- Coming Soon
- CONFIRMED
- continue
- continues
- could
- Couple
- cryptocurrency
- cryptoquant
- Currently
- data
- Decline
- difference
- different
- discussed
- Dominance
- down
- driver
- during
- ETH
- eth price
- Ether (ETH)
- ethereum
- Ethereum Price
- Ethereum prices
- exchange
- Exchanges
- explained
- Explains
- few
- First
- fluctuations
- followed
- For
- Former
- from
- future
- Gains
- generally
- given
- going
- gone
- graph
- greater
- hand
- Happening
- Have
- here
- higher
- Highlighted
- Hits
- hold
- How
- HTTPS
- image
- in
- index
- Indicator
- Indicators
- influence
- instead
- interest
- Investors
- IT
- ITS
- just
- Last
- like
- Listed
- looking
- Low
- major
- Majority
- Market
- May..
- means
- metric
- Metrics
- more
- moves
- moving
- moving average
- naturally
- Near
- negative
- Neutral
- New
- NewsBTC
- Notes
- now
- of
- on
- once
- opposite
- order
- orders
- Other
- out
- over
- past
- Pattern
- paved
- periods
- platform
- plato
- Plato Data Intelligence
- PlatoData
- positive
- possible
- possibly
- potential
- Premium
- present
- pressure
- price
- price chart
- Prices
- Quant
- rally
- ratio
- relationship
- relatively
- relevance
- right
- Rise
- see
- sell
- sentiment
- shift
- Shows
- sign
- significant
- Similarly
- since
- some
- Soon
- Source
- start
- strong
- stronger
- such
- suggest
- tells
- than
- that
- The
- The Coinbase
- There.
- These
- they
- Think
- this
- threshold
- time
- to
- topped
- towards
- track
- Trading
- TradingView
- Trend
- Trends
- TURN
- Unsplash
- until
- us
- use
- usually
- value
- Values
- visible
- volume
- Way..
- week
- whenever
- which
- WHO
- with
- would
- writing
- years
- yesterday
- yet
- you
- zephyrnet