With the 14th anniversary of the Great Financial Crisis of 2008 approaching, we are about to enter a new debt cycle that could reset the market. Navigating upcoming crises requires a deep understanding of how all previous debt crises worked and why they happened.
Ray Dalio, the founder and chairman of Bridgewater Associates, was the first to put out the theory of the archetypal big debt cycles. Dalio separates these into short-term and long-term cycles, where short-term ones last 5 to 7 years and long-term ones last around 75 years.
These archetypes form the foundation of Bridgewater’s investment strategy and have served as a lifeboat that enabled the hedge fund to navigate economic turmoil in the past 30 years.
Looking at the current market through this lens shows that we are nearing the end of the cycle that began in 1944 with the signing of the Bretton Woods agreement. The Bretton Woods system brought on what can effectively be called the U.S. dollar world order — which continued even after the abandonment of the gold standard in 1971.
Debt cycles
In a debt cycle, the scarcity of credit determines where the money ends up. When credit is abundant, and money flows through the economy, people invest in scarce assets like gold or real estate. When credit is scarce and there’s a lack of money in the economy, people turn to cash, and scarce assets see their value drop.
Since 2008, interest rates have either been incredibly low or near zero, drastically increasing the economy’s abundance of credit and money. This decline led to a notable increase in the value of scarce assets such as gold and real estate and speculative investments like stocks.
The most extreme example of this trend is seen in the U.S., as it’s the largest market-driven economy in the world. However, this trend led to the debt-to-GDP ratio in the U.S. rising over 100%, making its economy extremely sensitive to the movements of interest rates.
Historically, every time the market has seen a notable movement of interest rates, a liquidity crisis ensued. With the Federal Reserve expected to continue aggressively hiking interest rates well into next spring, the market could be gearing up for an unprecedented liquidity crisis.
Bitcoin paints a picture
Understanding the scope of the crisis requires taking a deep look into Bitcoin. Although it’s still among the most novel asset classes, Bitcoin is one of the most liquid assets in the world.
In the past year, Bitcoin’s performance served as a frontrunner to the performance of all other markets.
At the beginning of November 2021, Bitcoin reached its all-time high of $69,000.

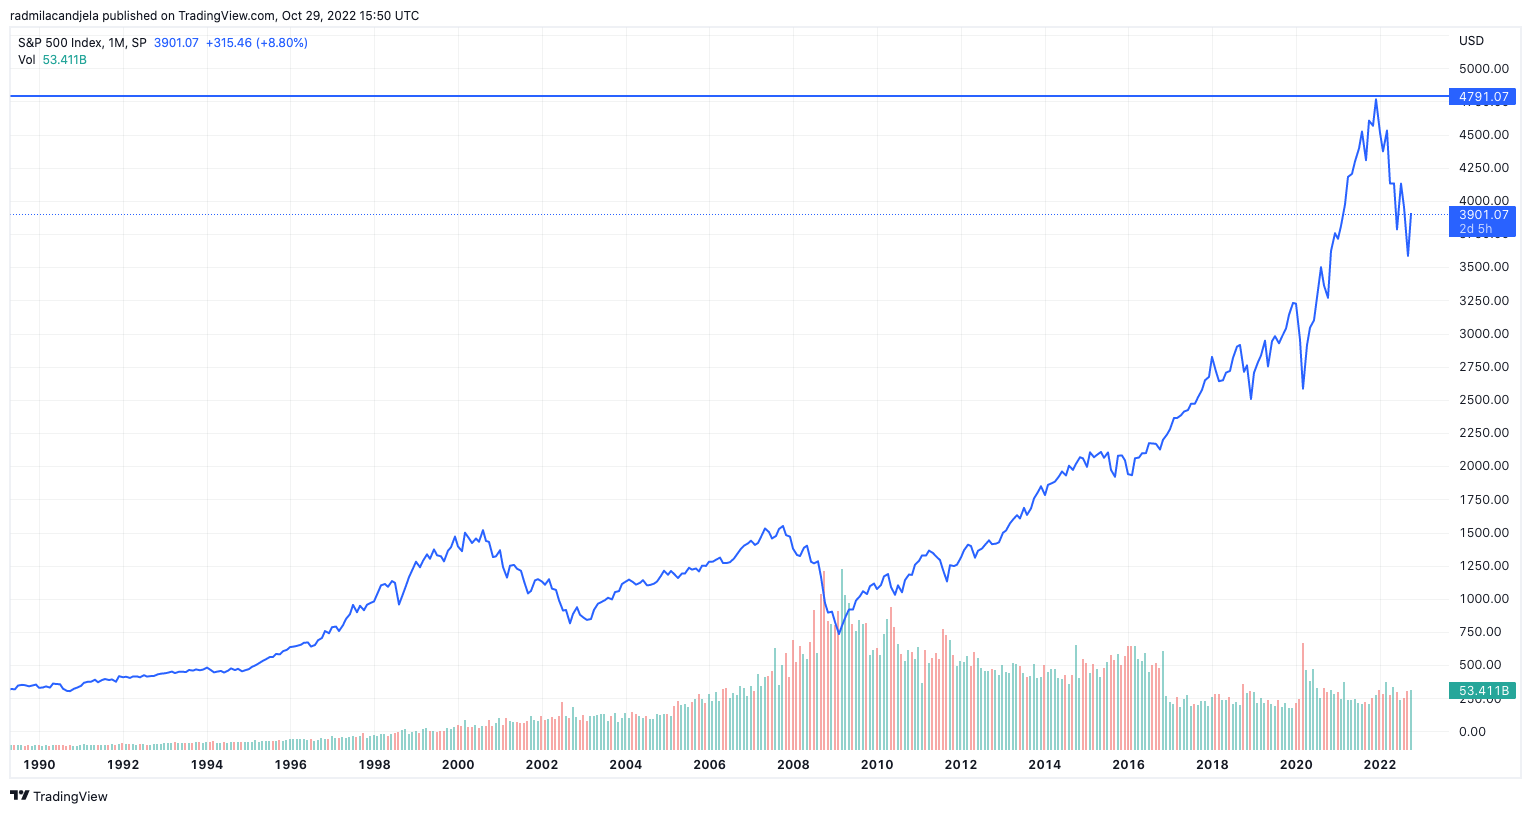
Just under two months later, at the end of December 2021, the S&P 500 saw its peak.
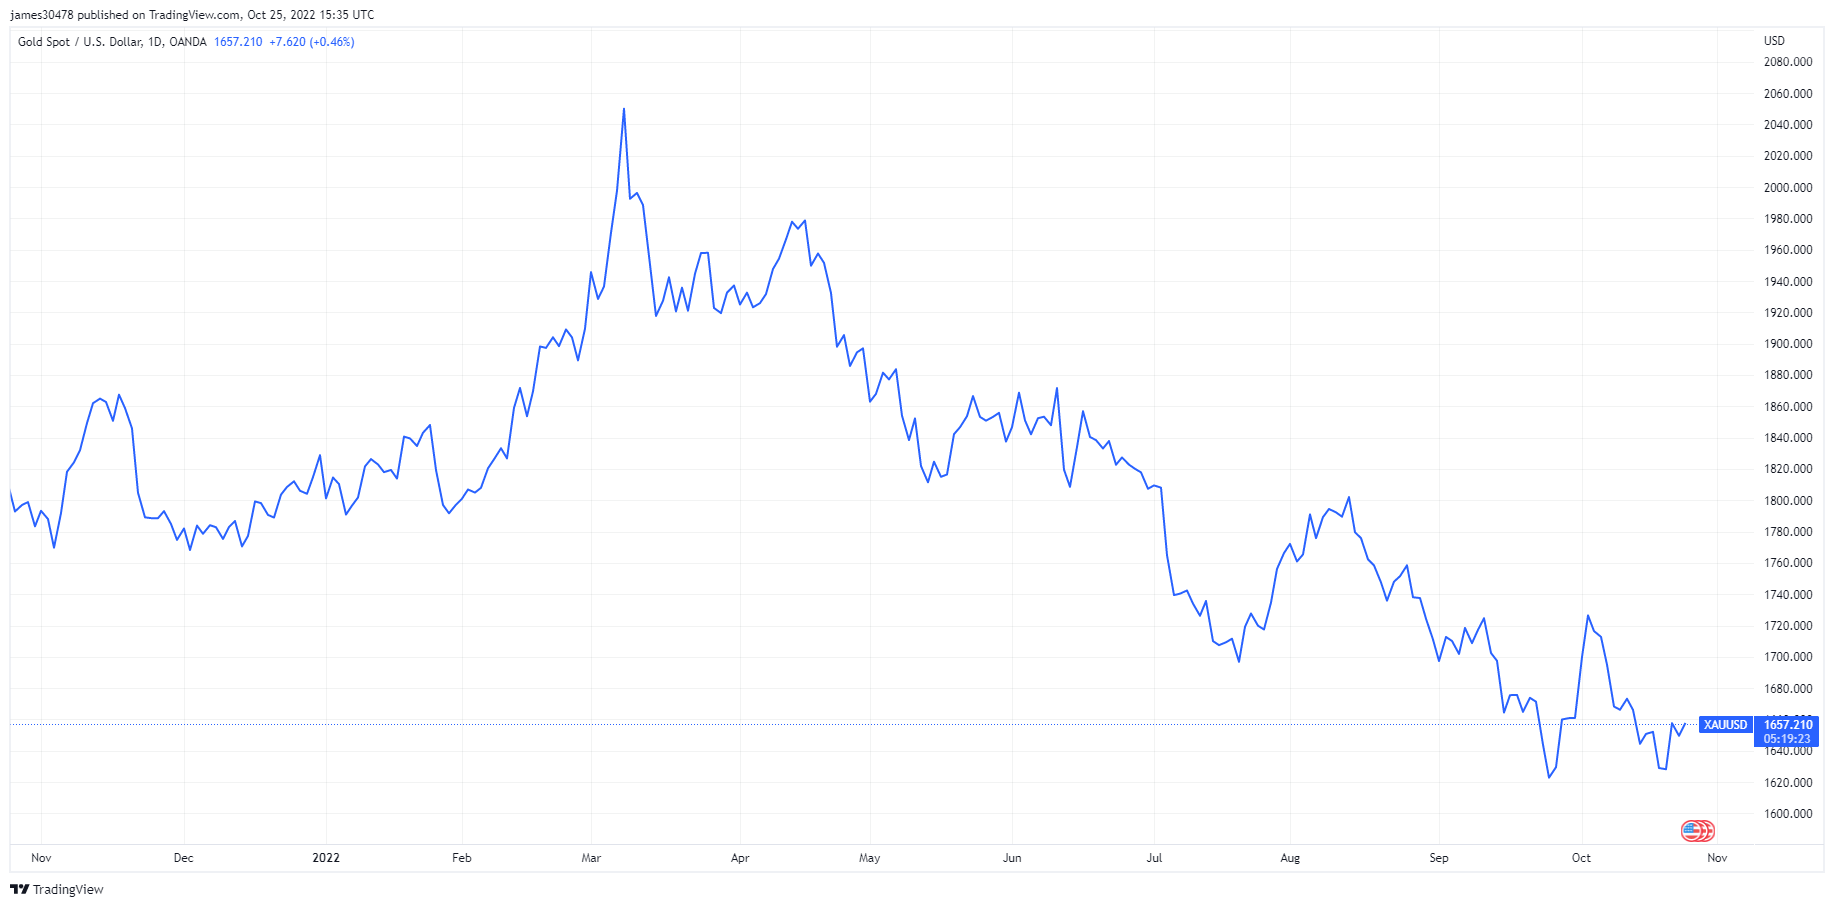
In March 2022, gold followed suit and reached its all-time high.
Alternative assets
Watches, cars, and jewelry have also seen their peak alongside gold as an abundance of money in the economy pushed people to invest in luxury and scarce assets. This trend is evident in the Rolex Market Index, which shows the financial performance of the top 30 Rolex watches on the secondhand market.

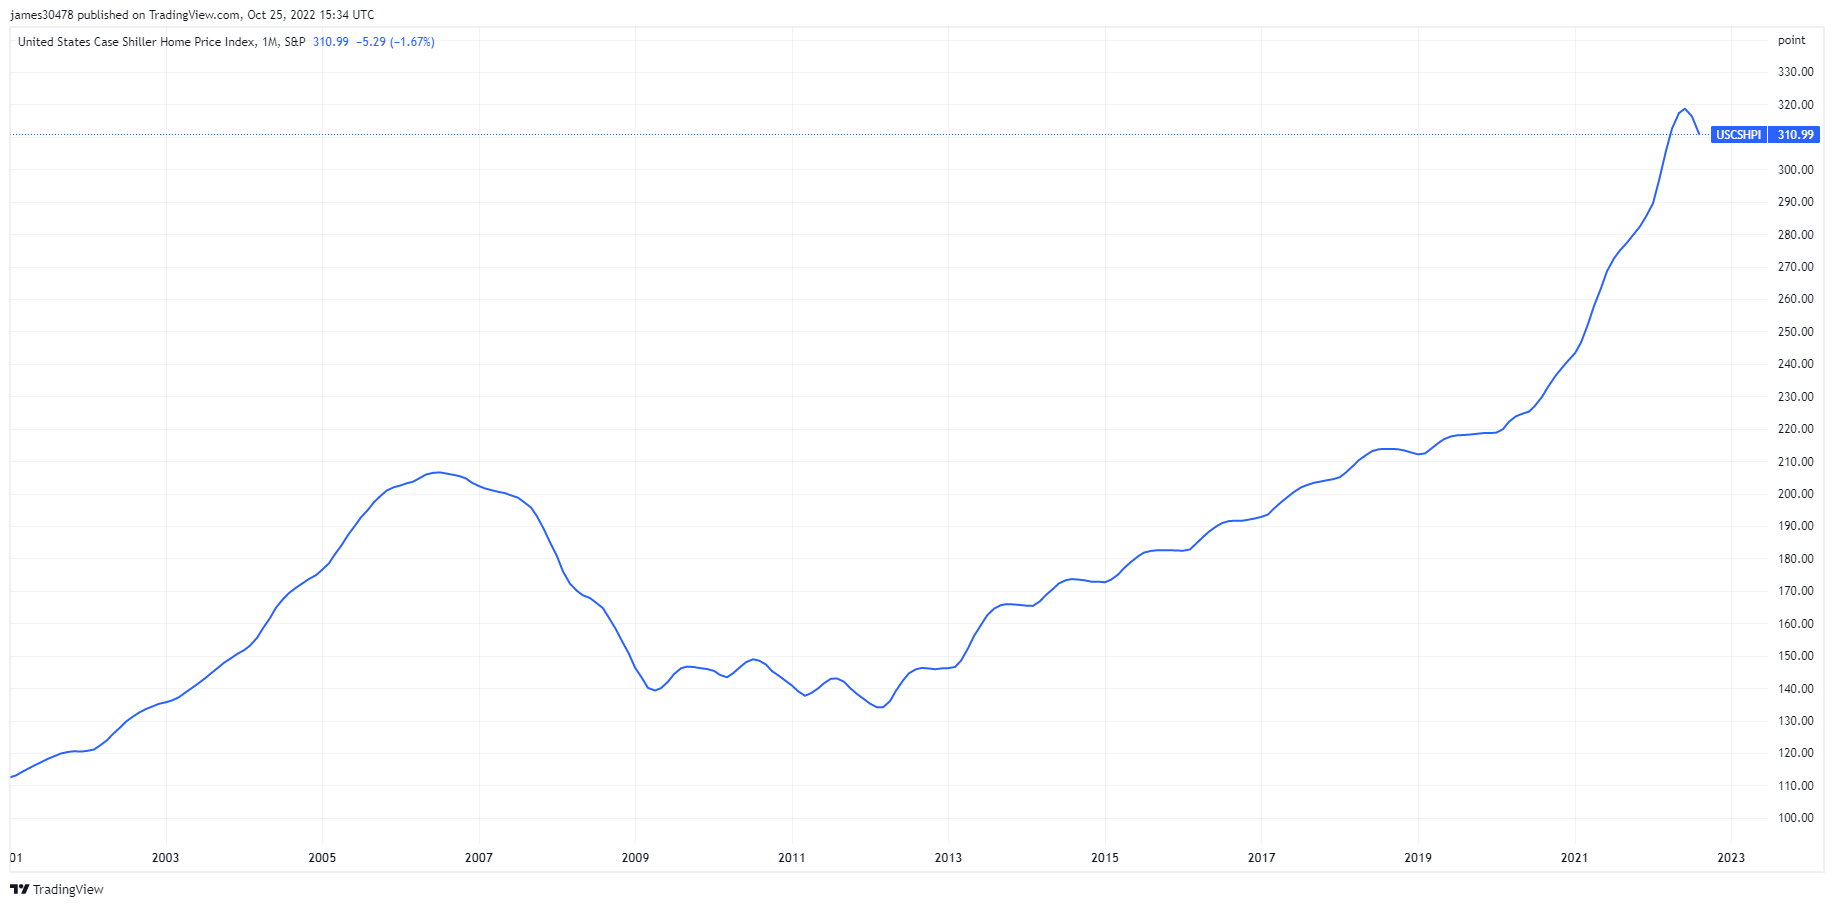
And now, as their most illiquid asset, real estate is about to see a sharp fall. The housing market in the U.S. reached its peak in September 2022, with the Case Shiller Home Price Index reaching its all-time high of 320. The Federal Reserve’s aggressive rate hike has caused mortgage rates in the country to double in less than six months. When combined with soaring inflation and a struggling market, rising mortgage rates are set to push housing prices downwards and wipe out billions from the real estate market.

- Bear Market
- Bitcoin
- blockchain
- blockchain compliance
- blockchain conference
- coinbase
- coingenius
- Consensus
- crypto conference
- crypto mining
- cryptocurrency
- CryptoSlate
- Debt
- decentralized
- DeFi
- Digital Assets
- ethereum
- financial crisis
- machine learning
- non fungible token
- plato
- plato ai
- Plato Data Intelligence
- Platoblockchain
- PlatoData
- platogaming
- Polygon
- proof of stake
- research
- W3
- zephyrnet