Inflation has become one of the most pressing global economic issues today. Rising prices have drastically reduced both the overall wealth and the purchasing power of a huge chunk of the developed world.
And while inflation certainly is one of the biggest drivers of economic crisis, a bigger danger looms around the corner — stagflation.
Stagflation and its effect on the market
First coined in 1965, the term stagflation describes an economic cycle with a persistently high inflation rate combined with high unemployment and stagnant demand in a country’s economy. The term was popularized in the 1970s as the U.S. entered into a prolonged oil crisis.
Since the 1970s, stagflation has been a repeating occurrence in the developed world. Many economists and analysts believe that the U.S. is about to enter a period of stagflation in 2022, as inflation and a rising unemployment rate become increasingly hard to tackle.
One of the ways stagflation can be measured is through real rates — interest rates adjusted for inflation. Looking at real rates shows the real yield and real returns on assets, revealing the real direction of the economy.
According to the U.S. Bureau of Labor Statistics, the consumer price index (CPI) recorded an inflation rate of 8.5% in July. The July CPI posted an increase of just 1.3% from its May numbers, prompting many policymakers to dismiss the severity of the current inflation rate.
However, real rates paint a much different picture.
The 10-year U.S. Treasury yield currently stands at 2.8%. With inflation at 8.5%, the real yield on owning U.S. Treasury bills is 5.7%.
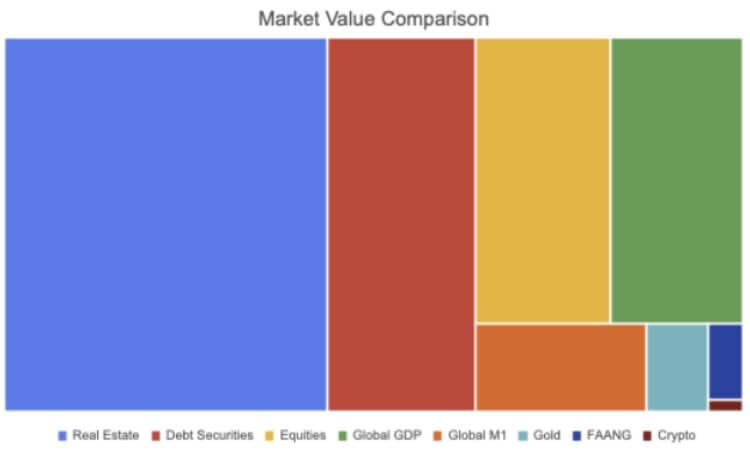
As of 2021, the size of the global bond market is estimated to be around $119 trillion. According to the Securities Industry and Financial Markets Association (SIFMA), around $46 trillion of that comes from the U.S. market. All of the fixed-income market SFIMA tracks, which include mortgage-backed securities (MBS), corporate bonds, municipal securities, federal agency securities, asset-backed securities (ABS), and money markets, currently have negative returns when adjusted for inflation.
The S&P 500 index also falls in the same category. The Shiller price-to-earnings (P/E) ratio puts the S&P index in the hugely overvalued category. The ratio shows the S&P index’s inflation-adjusted earnings for the previous 10 years and is used to measure the stock market’s overall performance. The current Shiller P/E ratio of 32.26 is considerably higher than the levels recorded ahead of the financial crisis in 2008 and is on par with the Great Depression in the late 1920s.

The real estate market has also found itself struggling. In 2020, the value of the global real estate market reached $326.5 trillion — a 5% increase from its 2019 value and a record high.
An increasing population that’s fueling a housing shortage was expected to push this number even higher this year. In the U.S., interest rates have been pegged to nearly zero since the 2008 financial crisis, making mortgages cheap and increasing housing sales across the country.
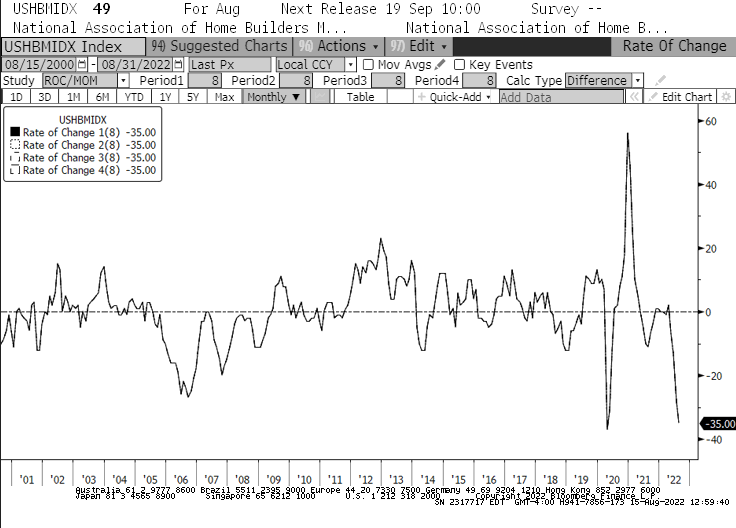
The rise in interest rates we’ve seen since the beginning of the year is set to change this. From January, the National Association of Home Builders (NAHB) housing market index saw its fastest -35 decline in history. The drop recorded in the index was faster than in 2008 when the housing bubble suddenly burst. This is also the longest monthly decline the NAHB index has seen, as August marked its 8th consecutive month of decline for the first time since 2007.
With almost every segment of the market posting declines, we could see a significant number of institutions and asset managers reconsidering their portfolios. Overvalued property, overbought equities, and negative real yield bonds are all heading into a stagflationary period that could last up to several years.
Large institutions, asset managers, and hedge funds could all be forced to make a tough choice — stay in the market, weather the storm, and risk both short and long-term losses, or rebalance their portfolios with diverse assets that have a better chance of growing in a stagflationary market.
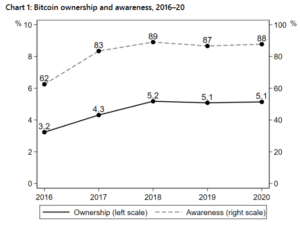
Even if just some institutional players decide to take the latter route, we could see an increasing amount of money flowing into Bitcoin (BTC). The crypto industry has seen unprecedented growth in institutional adoption, with assets other than just Bitcoin becoming an integral part of many large investment portfolios.
However, as the largest and most liquid crypto asset, Bitcoin could be the target of the majority of those investments.
- Bitcoin
- blockchain
- blockchain compliance
- blockchain conference
- coinbase
- coingenius
- Consensus
- crypto conference
- crypto mining
- cryptocurrency
- CryptoSlate
- decentralized
- DeFi
- Digital Assets
- ethereum
- inflation
- machine learning
- Macro
- Market Analysis
- non fungible token
- plato
- plato ai
- Plato Data Intelligence
- Platoblockchain
- PlatoData
- platogaming
- Polygon
- proof of stake
- research
- stagflation
- W3
- zephyrnet